


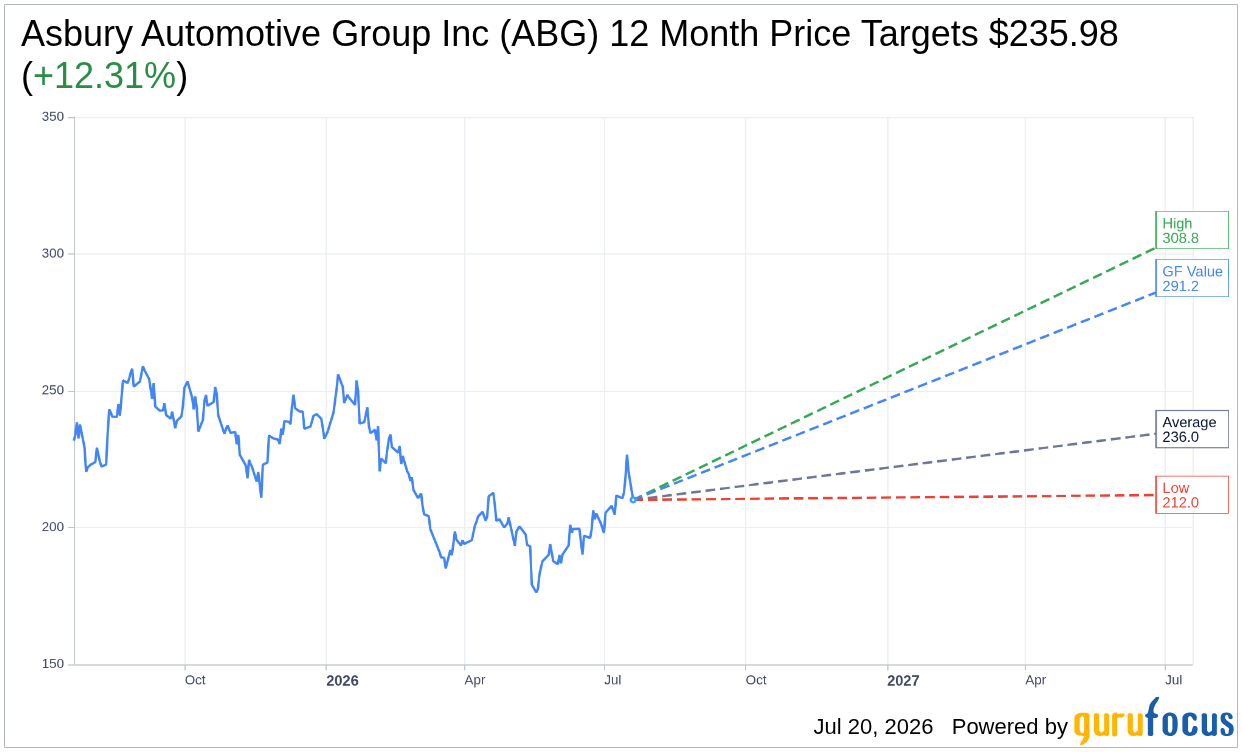
On July 20, 2026, Asbury Automotive Group Inc ABG shares experienced a decline of 4.7%, bringing the current price to $210.12. This drop comes amidst a 52-week range that saw a high of $263.38 and a low of $172.01, highlighting the volatility in the stock's performance over the past year.
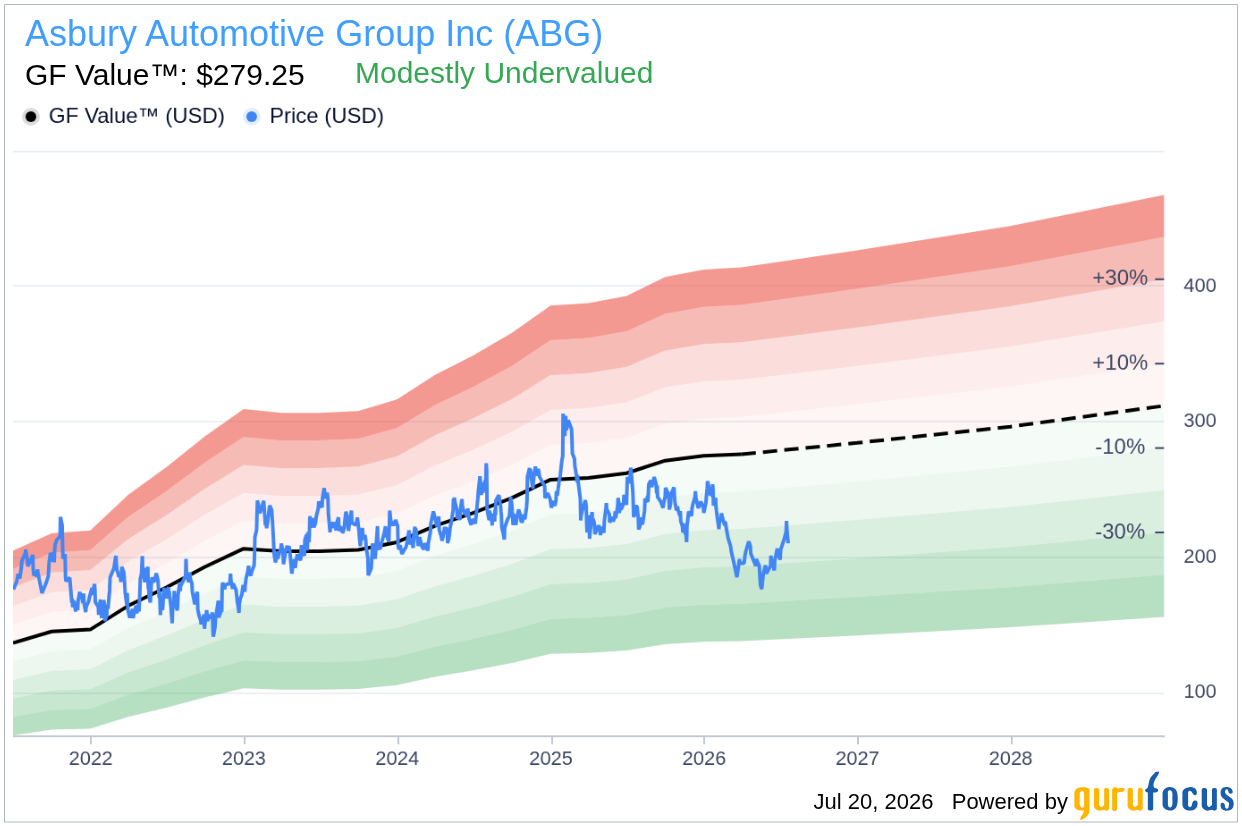
- GF Value™ verdict: Current price of $210.12 vs GF Value™ of $279.25, indicating a 24.8% undervaluation.
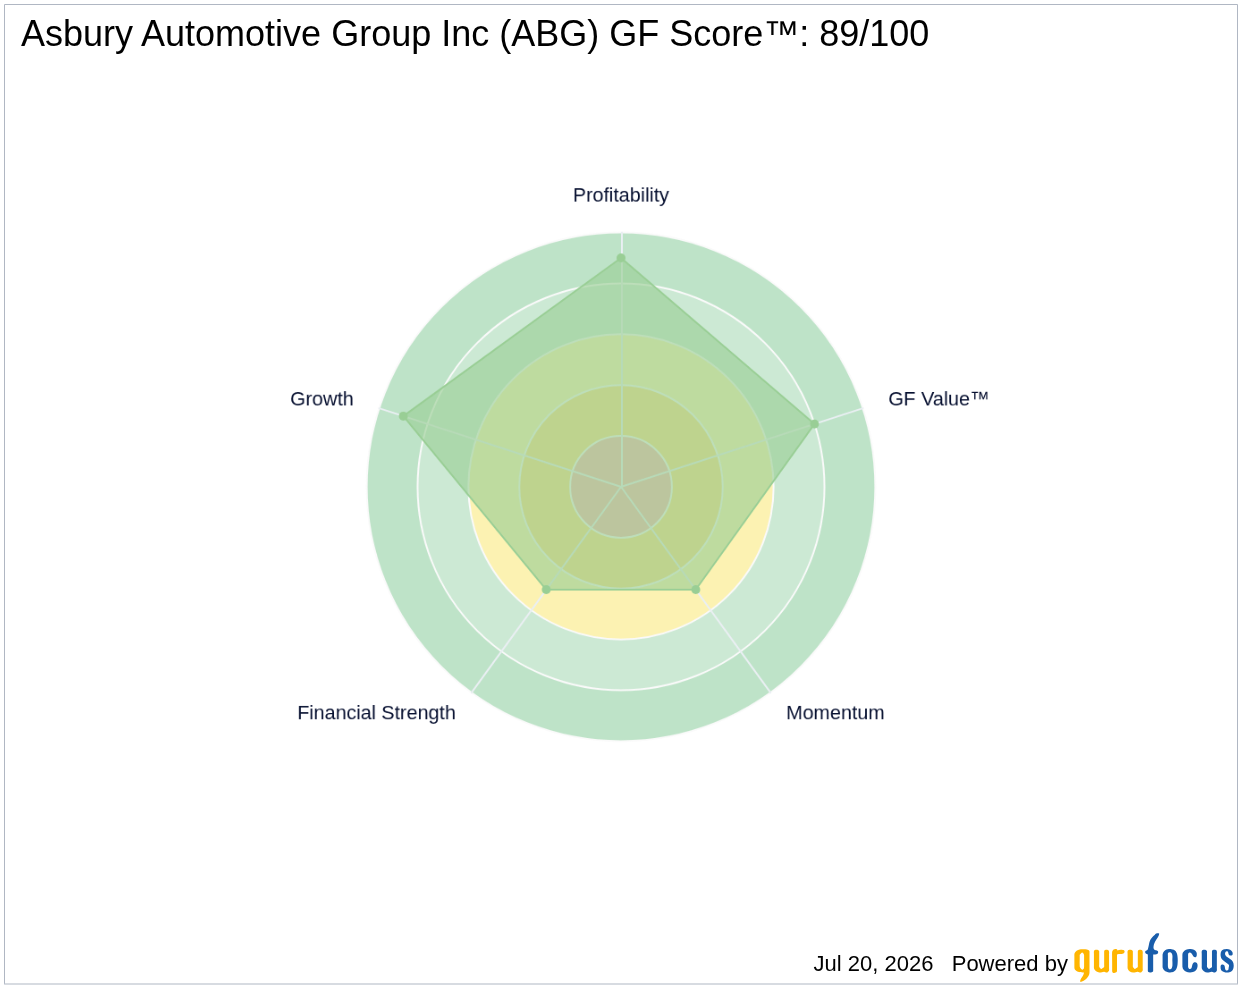
- GF Score™: 89/100 (Strong), suggesting the stock has a robust overall appeal based on multiple financial metrics.
- Most notable signal: Insiders bought $0.0M in the last 3 months, indicating no selling activity.
Is ABG Overvalued or Undervalued?
Currently, Asbury Automotive Group Inc ABG is trading at $210.12, which is significantly below its GF Value™ of $279.25, reflecting a 24.8% margin of safety. This undervaluation may present a potential investment opportunity for those looking for stocks trading below their intrinsic value. It is essential to consider that while the stock is labeled as "Modestly Undervalued" by the GF Valuation metric, investors should weigh this against potential market risks and the company’s performance trends.
GF Value™ is GuruFocus' proprietary measure of intrinsic value, calculated from historical trading multiples, past business growth, and future performance estimates. The current price indicates that the market may not fully recognize the company's underlying value, which can be a favorable scenario for long-term investors, provided that business fundamentals remain strong.
How Does ABG's Valuation Compare to Its History?
| Metric | Current | Historical |
|---|---|---|
| P/E (TTM) | 7.4x | 7.4x (5-Year Median) |
| Forward P/E | 8.2x | N/A |
Asbury Automotive Group's current price-to-earnings (P/E) ratio stands at 7.4x, which is 1% above its 5-year median P/E of 7.4x. The forward P/E of 8.2x suggests slight expectations for earnings growth. This analysis aligns with the GF Value™ verdict, indicating that while the stock is trading near its historical valuation, there remains a significant opportunity for value appreciation given the current market price.
What Does ABG's GF Score™ Tell Us?
| Metric | Rating |
|---|---|
| GF Score™ | 89 |
| Financial Strength | 5/10 |
| Profitability | 9/10 |
| Growth | 9/10 |
| Valuation | 8/10 |
| Momentum | 5/10 |
The GF Score™ of 89/100 indicates a strong overall investment potential for ABG, driven by high ratings in Profitability (9/10) and Growth (9/10). However, Financial Strength (5/10) is a weaker area, suggesting that while the company is performing well in generating profits and expanding, it may need to improve its financial robustness. This mixed profile indicates that ABG possesses solid growth prospects but should address its financial stability to enhance investor confidence.
What Are Insiders Doing with ABG Stock?
In the past three months, there has been no insider activity related to Asbury Automotive Group Inc, with insiders buying $0.0M worth of shares and no selling reported. This lack of insider trading can suggest a neutral sentiment among executives regarding the stock's outlook, indicating that they may not view the current price as a compelling buying opportunity. However, it also implies that insiders are not seeking to divest, which can be interpreted as a sign of confidence in the long-term prospects of the company.
What This Means for Investors
Based on the GF Value™ assessment, Asbury Automotive Group Inc ABG is currently undervalued. With a significant margin of safety of 24.8%, opportunities may exist for investors seeking solid long-term prospects in the automotive industry. However, investors should remain vigilant regarding potential market fluctuations and company performance indicators.
For the complete analysis, visit the Asbury Automotive Group Inc ABG stock page. You can also explore the GF Value™ page for detailed valuation methodology, or use the GuruFocus Stock Screener to find similar opportunities.
Frequently Asked Questions
What is ABG's GF Score™?
ABG's GF Score™ is 89/100, indicating a strong overall investment potential based on various financial metrics.
Is ABG overvalued or undervalued?
ABG is currently undervalued according to the GF Value™, with a significant margin of 24.8% compared to its estimated intrinsic value.
What is ABG's P/E ratio?
ABG's P/E (TTM) ratio is 7.4x, which aligns with its 5-year median P/E, indicating the stock is trading near its historical valuation.
This stock alert was generated using automated technology and GuruFocus financial data to provide readers with timely and accurate market reporting. This content was reviewed by GuruFocus editorial team prior to publication. Please send any questions or comments about this story to [email protected].

