


On July 21, 2026, MSCI MSCI showcased robust financial performance in Q2 2026, achieving organic revenue growth exceeding 12% and adjusted EPS growth of nearly 19%. The company repurchased $147 million of its shares at an average price of $558 during the quarter. Total run rate growth reached 12%, bolstered by a substantial $948 million ABF run rate, which grew by 25%. The firm also announced a strategic partnership with UBS and plans to acquire First Street, expected to enhance subscription run rates by approximately $10 million upon completion in Q3.
- Market Cap: $40.89 billion
- GF Score™: 95/100, indicating strong potential for long-term returns
- Insider Activity: Sold $6.2 million in shares over the past three months
What's Behind the News?
MSCI's impressive Q2 results reflect the company's strong position in the financial services sector, particularly in capital markets. The organic revenue growth of over 12% and adjusted EPS growth of nearly 19% highlight MSCI's ability to expand its business effectively. The strategic partnership with UBS and the planned acquisition of First Street are expected to further enhance MSCI's subscription run rates, demonstrating the company's commitment to growth and innovation in its offerings.
MSCI Inc operates as an independent provider of research-driven insights and tools for institutional investors. With a market capitalization of approximately $40.89 billion, the company serves a vast array of clients, offering services that include benchmarking, portfolio management, and risk management analytics. Its index segment is particularly noteworthy, with over $18 trillion in benchmarked assets, making MSCI a key player in the investment landscape.
How Is MSCI Valued?
Currently, GF Value™ data is not available for MSCI stock. However, the stock is trading at a P/E ratio of 32.08, which indicates how the market values the company's earnings relative to its stock price. This P/E ratio is a crucial metric for investors assessing whether the stock is overvalued or undervalued compared to its historical performance and industry peers. For more detailed valuation insights, visit the MSCI stock page.
What Does MSCI's GF Score™ Tell Us?
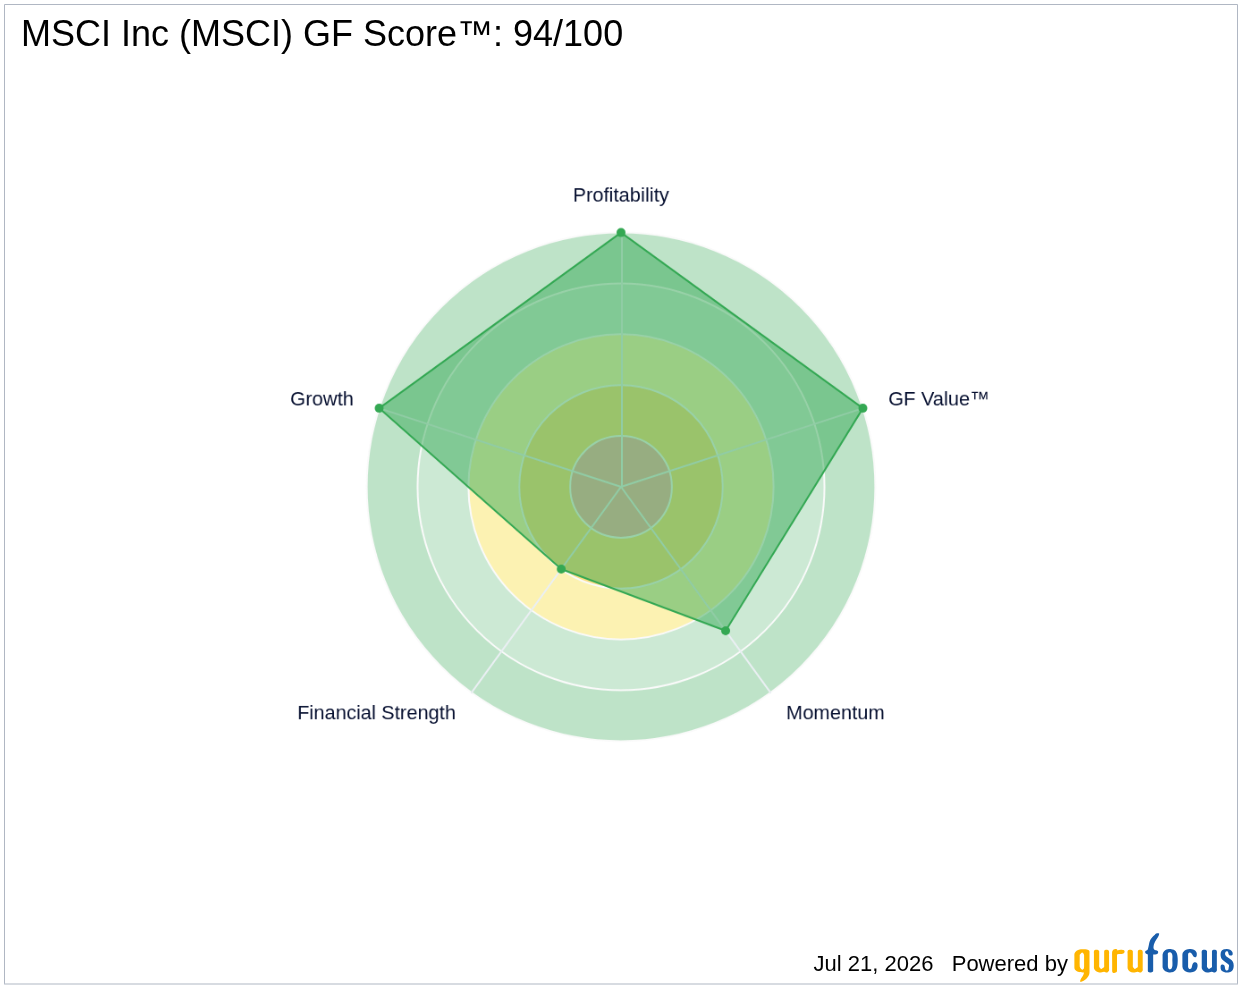
The GF Score™ ranks stocks from 0 to 100 based on five key aspects: Financial Strength, Profitability, Growth, Valuation, and Momentum. Stocks with higher GF Score™ values have been found to generate higher long-term returns (backtested 2006-2021).
| Metric | Rating |
|---|---|
| GF Score™ | 95 |
| Financial Strength | 4/10 |
| Profitability | 10/10 |
| Growth | 10/10 |
MSCI's strengths lie in its exceptional profitability and growth rankings, both at 10/10, indicating a strong ability to generate earnings and expand its business. However, its financial strength rating of 4/10 suggests that there may be some concerns regarding its balance sheet and debt levels. Overall, the high GF Score™ of 95 indicates that MSCI is well-positioned for long-term success. For further insights, visit the MSCI stock page.
What Are Insiders Doing with MSCI Stock?
In the past three months, insiders have sold a total of $6.2 million in shares, indicating a level of caution among those closest to the company. However, there was one insider buying transaction, where 4,000 shares were purchased, suggesting some confidence in the company's future performance.
What This Means for Investors
MSCI's strong GF Score™ and impressive growth metrics indicate a solid investment opportunity, despite some insider selling. Investors should consider the company's robust financial performance and strategic initiatives as positive signals for future growth. However, the insider selling may warrant further investigation into the company's short-term outlook. For the complete analysis, visit the MSCI stock page. You can also use the GuruFocus Stock Screener to find similar opportunities.
Frequently Asked Questions
What is MSCI's GF Score™?
MSCI's GF Score™ is 95/100, indicating a strong potential for long-term returns based on various financial metrics.
How is MSCI valued?
MSCI is currently valued with a P/E ratio of 32.08, reflecting the market's assessment of its earnings relative to its stock price.
What is MSCI's P/E ratio compared to historical?
The current P/E ratio of 32.08 is a critical metric for investors, as it provides insight into how MSCI's valuation compares to its historical performance and industry standards.
This stock alert was generated using automated technology and GuruFocus financial data to provide readers with timely and accurate market reporting. This content was reviewed by GuruFocus editorial team prior to publication. Please send any questions or comments about this story to [email protected].

