


On July 22, 2026, Avino Silver & Gold Mines Ltd ASM released its production figures for the second quarter of 2026, highlighting a total output of 267,305 ounces of silver, 2,178 ounces of gold, and 729,929 pounds of copper. The company reported a total of 534,945 ounces of silver equivalent, reflecting a significant 59% increase in silver production from the La Preciosa project.
- Current P/E ratio stands at 27.09, indicating a valuation context that is close to its 1-year low.
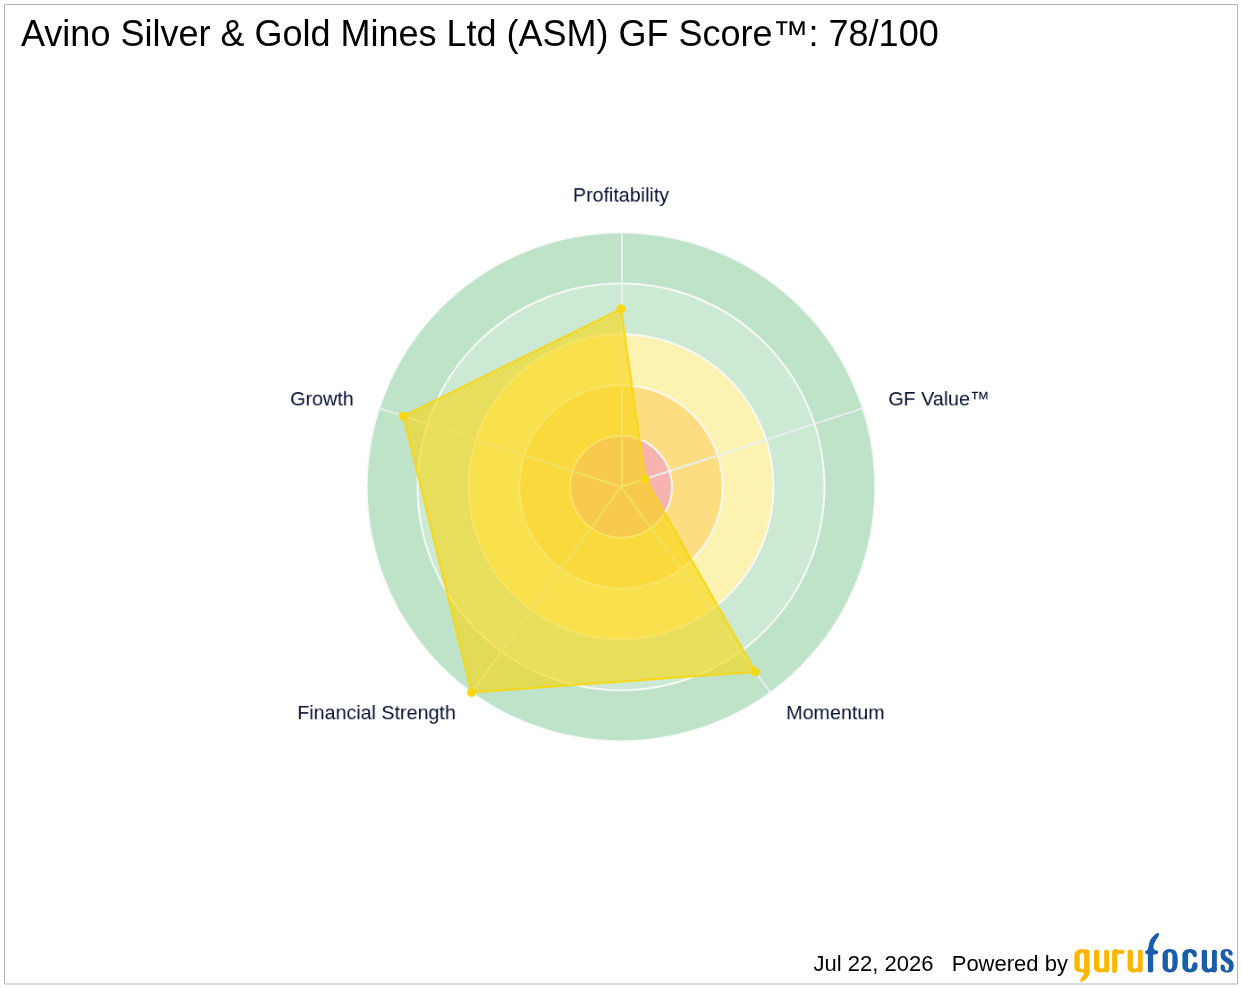
- GF Score™ of 78/100 suggests a strong overall performance based on GuruFocus' proprietary metrics.
- Financial strength is rated at 10/10, indicating robust financial health.
What's Behind the News?
The recent production figures from Avino Silver & Gold Mines Ltd underscore the company's operational improvements, particularly from its La Preciosa project. The 59% increase in silver production is a noteworthy achievement, reflecting the effectiveness of ongoing development work and enhanced milling operations. CEO David Wolfin expressed optimism regarding the company's trajectory, anticipating stronger production in the latter half of 2026 as the project continues to advance.
Avino Silver & Gold Mines Ltd operates in the Basic Materials sector, specifically within the Metals & Mining industry. With a market capitalization of approximately $1.07 billion, the company is engaged in the exploration, extraction, and processing of silver, gold, and copper. Its portfolio includes several projects, with La Preciosa being a key contributor to its production output.
How Is ASM Valued?
Currently, GF Value™ data for ASM is not available. However, the company's P/E ratio of 27.09x indicates that the stock is trading at a premium compared to its earnings. This P/E ratio is close to its 1-year low of 24.43, suggesting that the stock may be undervalued relative to its historical performance. For more detailed valuation insights, visit the ASM stock page.
What Does ASM's GF Score™ Tell Us?
The GF Score™ ranks stocks from 0 to 100 based on five key aspects: Financial Strength, Profitability, Growth, Valuation, and Momentum. Stocks with higher GF Score™ values have been found to generate higher long-term returns (backtested 2006-2021).
| GF Score™ | 78 |
| Financial Strength | 10/10 |
| Profitability | 7/10 |
| Growth | 9/10 |
| Valuation | Significantly Overvalued |
Avino Silver & Gold Mines Ltd demonstrates strong financial strength with a perfect score of 10/10, indicating a solid balance sheet and operational efficiency. Its profitability and growth ranks of 7/10 and 9/10, respectively, further highlight the company's ability to generate returns and expand its operations. However, the valuation aspect indicates that the stock may be significantly overvalued at present. For more insights, visit the ASM stock page.
What Are Insiders Doing with ASM Stock?
In the past three months, there have been two insider selling transactions with a total of 73,300 shares sold. Notably, there have been no insider buying activities during this period, which may raise some concerns about insider confidence in the stock.
What This Means for Investors
Investors should consider the strong operational performance and financial health of Avino Silver & Gold Mines Ltd, as indicated by its GF Score™ and financial metrics. However, the significant insider selling may warrant caution. Overall, the company appears to be on a promising trajectory, but potential investors should weigh these factors carefully. For the complete analysis, visit the ASM stock page. You can also use the GuruFocus Stock Screener to find similar opportunities.
Frequently Asked Questions
What is ASM's GF Score™?
ASM's GF Score™ is 78/100, indicating a strong overall performance based on GuruFocus' proprietary metrics.
How is ASM valued?
ASM is currently valued with a P/E ratio of 27.09, which is close to its 1-year low of 24.43, suggesting it may be undervalued relative to its historical performance.
What is ASM's P/E ratio compared to historical?
ASM's current P/E ratio of 27.09 is near its 1-year low of 24.43, indicating that the stock is trading at a valuation that is relatively low compared to its historical range.
This stock alert was generated using automated technology and GuruFocus financial data to provide readers with timely and accurate market reporting. This content was reviewed by GuruFocus editorial team prior to publication. Please send any questions or comments about this story to [email protected].

