


On July 22, 2026, SS&C Technologies Holdings Inc SSNC reported a notable decline in its SS&C GlobeOp Forward Redemption Indicator for July 2026, which is now at 1.35%, down from June's 1.72%. This figure represents one of the lowest readings on record, indicating a shift in market dynamics. The Chairman and CEO of SS&C Technologies highlighted that the significant unwind of momentum trades in artificial intelligence and semiconductors, alongside rising tensions in the Middle East, has contributed to increased volatility in global markets.
- Market Cap: $16.36 billion
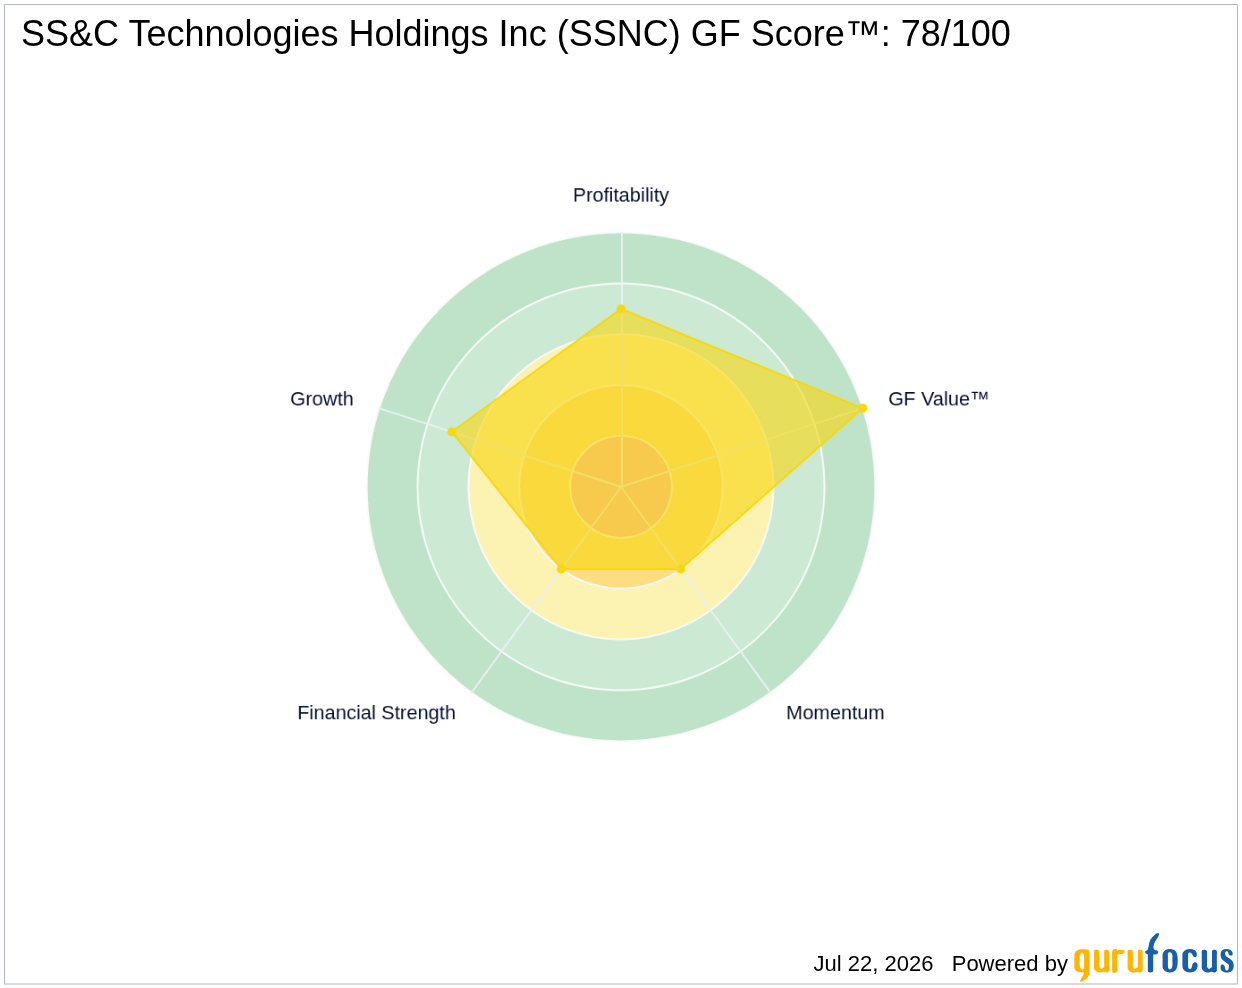
- GF Score™: 78/100, indicating a strong potential for long-term returns
- Insider Activity: Sold $0.6 million in shares over the past three months
What's Behind the News?
The decline in the SS&C GlobeOp Forward Redemption Indicator is significant as it suggests a stabilization in hedge fund investments despite the prevailing market volatility. The reduction in redemptions indicates that investors are maintaining their positions, which may reflect confidence in hedge funds' ability to deliver uncorrelated returns and strong risk-adjusted performance. This trend is particularly noteworthy given the backdrop of market fluctuations driven by technological sector corrections and geopolitical tensions.
SS&C Technologies Holdings Inc operates in the technology sector, primarily providing software products and software-enabled services to clients in financial services. With a market capitalization of approximately $16.36 billion, the company has a diverse portfolio that includes fund administration services through SS&C GlobeOp, as well as software solutions for portfolio accounting, management, and trading. The company has a history of strategic acquisitions, enhancing its capabilities and market presence.
How Is SSNC Valued?
Currently, GF Value™ data is not available for SS&C Technologies. However, the company's P/E ratio stands at 21.04x, which is close to its 5-year median P/E ratio. This suggests that the stock is trading at a valuation that is relatively consistent with its historical performance. Investors may find this stability appealing, particularly in a market characterized by volatility. For further details, visit the SSNC stock page.
What Does SSNC's GF Score™ Tell Us?
The GF Score™ ranks stocks from 0 to 100 based on five key aspects: Financial Strength, Profitability, Growth, Valuation, and Momentum. Stocks with higher GF Score™ values have been found to generate higher long-term returns (backtested 2006-2021).
| GF Score™ | 78 |
| Financial Strength | 4/10 |
| Profitability | 7/10 |
| Growth | 7/10 |
SS&C Technologies demonstrates strong profitability and growth ranks, indicating a solid operational performance and potential for future expansion. However, the financial strength rating of 4/10 suggests that there may be some concerns regarding the company's financial stability, particularly with an Altman Z-score indicating distress. For more insights, visit the SSNC stock page.
What Are Insiders Doing with SSNC Stock?
In the past three months, insiders have sold approximately $0.6 million worth of shares, with no insider buying activity reported. This trend may warrant attention from investors, as insider selling can sometimes indicate a lack of confidence in the company's near-term prospects.
What This Means for Investors
Overall, SS&C Technologies Holdings Inc presents a mixed picture for investors. While the company's GF Score™ of 78/100 and strong profitability and growth rankings are positive indicators, the financial strength concerns and insider selling activity may raise red flags. Investors should weigh these factors carefully when considering their positions in SSNC.
For the complete analysis, visit the SSNC stock page. You can also use the GuruFocus Stock Screener to find similar opportunities.
Frequently Asked Questions
What is SSNC's GF Score™?
SSNC's GF Score™ is 78/100, indicating a strong potential for long-term returns based on various financial metrics.
How is SSNC valued?
SSNC is currently valued with a P/E ratio of 21.04x, which is close to its historical median, suggesting a stable valuation context.
What is SSNC's P/E ratio compared to historical?
SSNC's current P/E ratio of 21.04x is close to its 5-year median, indicating that the stock is trading at a valuation consistent with its historical performance.
This stock alert was generated using automated technology and GuruFocus financial data to provide readers with timely and accurate market reporting. This content was reviewed by GuruFocus editorial team prior to publication. Please send any questions or comments about this story to [email protected].

