


On July 22, 2026, AT&T Inc T released its second-quarter results, showcasing adjusted earnings that surpassed expectations, driven by strong subscriber additions. The company achieved an adjusted EPS of $0.65, exceeding the forecast of $0.59, while adjusted EBITDA reached $12.3 billion. Revenue grew by 2.3% year-over-year to $31.6 billion, slightly below the anticipated $31.77 billion.
- Market Cap: $154.67 billion
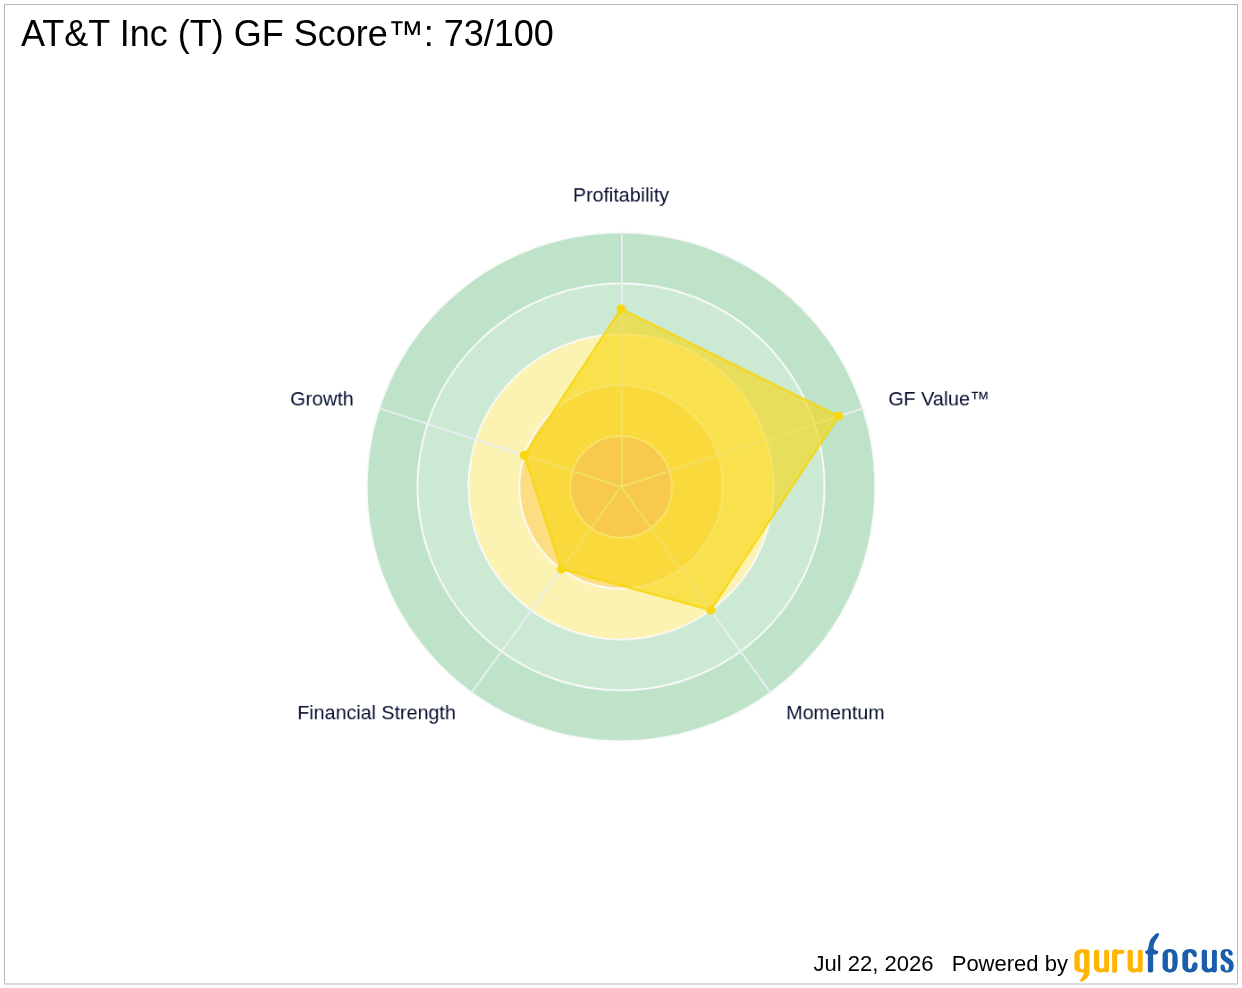
- GF Score™: 73/100, indicating a solid performance relative to peers.
- Financial Strength: AT&T has a current ratio of 0.92, indicating potential liquidity concerns.
What's Behind the News?
The second-quarter results highlight AT&T's ability to grow its subscriber base, adding over 1 million Advanced Connectivity customers during the quarter. This includes 646,000 new customers from fiber and fixed wireless services, along with an increase of 432,000 postpaid phone subscribers, all while maintaining a low churn rate of 0.86%. The company reaffirmed its goal of generating over $18 billion in free cash flow by 2026, which is a critical target for its ongoing financial health.
AT&T operates in the Communication Services sector, primarily within the Telecommunication Services industry. With a market capitalization of approximately $154.67 billion, the company is the third-largest wireless carrier in the U.S., connecting 74 million postpaid and 17 million prepaid phone customers. Its diverse revenue streams include fixed-line enterprise services and residential broadband, although the wireless business remains the largest contributor to its revenue.
How Is T Valued?
Currently, GF Value™ data is not available for AT&T. However, the company's trailing P/E ratio stands at 7.47, which is significantly lower than the industry average, suggesting that the stock may be undervalued relative to its earnings potential. The forward P/E ratio is 9.6, indicating a cautious outlook on future earnings growth. For more detailed valuation metrics, visit the T stock page.
What Does T's GF Score™ Tell Us?
The GF Score™ ranks stocks from 0 to 100 based on five key aspects: Financial Strength, Profitability, Growth, Valuation, and Momentum. Stocks with higher GF Score™ values have been found to generate higher long-term returns (backtested 2006-2021).
| Metric | Rating |
|---|---|
| GF Score™ | 73 |
| Financial Strength | 4/10 |
| Profitability | 7/10 |
| Growth | 4/10 |
AT&T's strengths lie in its profitability, with a profitability rank of 7/10, indicating solid margins and operational efficiency. However, its financial strength is a concern, with a rating of 4/10, suggesting potential liquidity issues. The company’s growth rank of 4/10 reflects challenges in revenue growth, particularly in the context of its declining revenue per share over the past five years. For more insights, visit the T stock page.
What Are Insiders Doing with T Stock?
There has been no insider buying or selling activity reported for AT&T over the past three months, indicating a stable outlook from current management regarding the company's future performance.
What This Means for Investors
AT&T's recent performance demonstrates its ability to attract new subscribers, which is crucial for its long-term growth strategy. However, the company's financial strength metrics raise concerns about its liquidity and overall financial health. Investors should weigh these factors carefully when considering their positions in AT&T. For the complete analysis, visit the T stock page. You can also use the GuruFocus Stock Screener to find similar opportunities.
Frequently Asked Questions
What is T's GF Score™?
T's GF Score™ is 73/100, indicating a solid performance relative to its peers and suggesting potential for long-term returns.
How is T valued?
AT&T's trailing P/E ratio is 7.47, which is significantly lower than the industry average, suggesting potential undervaluation.
What is T's P/E ratio compared to historical?
AT&T's current P/E ratio of 7.47 is close to a three-year low, indicating that the stock may be undervalued compared to its historical performance.
This stock alert was generated using automated technology and GuruFocus financial data to provide readers with timely and accurate market reporting. This content was reviewed by GuruFocus editorial team prior to publication. Please send any questions or comments about this story to [email protected].

