


On July 22, 2026, Nokia NOK is set to release its second-quarter earnings report. Analysts are predicting a GAAP EPS of €0.04 and revenue of €4.83 billion. The company is currently experiencing a surge in sales, particularly due to the increasing demand for its optical transport network systems, which are essential for data centers. Following a remarkable 49% revenue increase in Q1, attributed to AI and cloud customers, Nokia has raised its revenue outlook for its Network Infrastructure segment to a growth of 12% to 14%. Despite some caution from analysts, Wall Street maintains a Buy rating on the stock.
- Market Cap: €58.1 billion
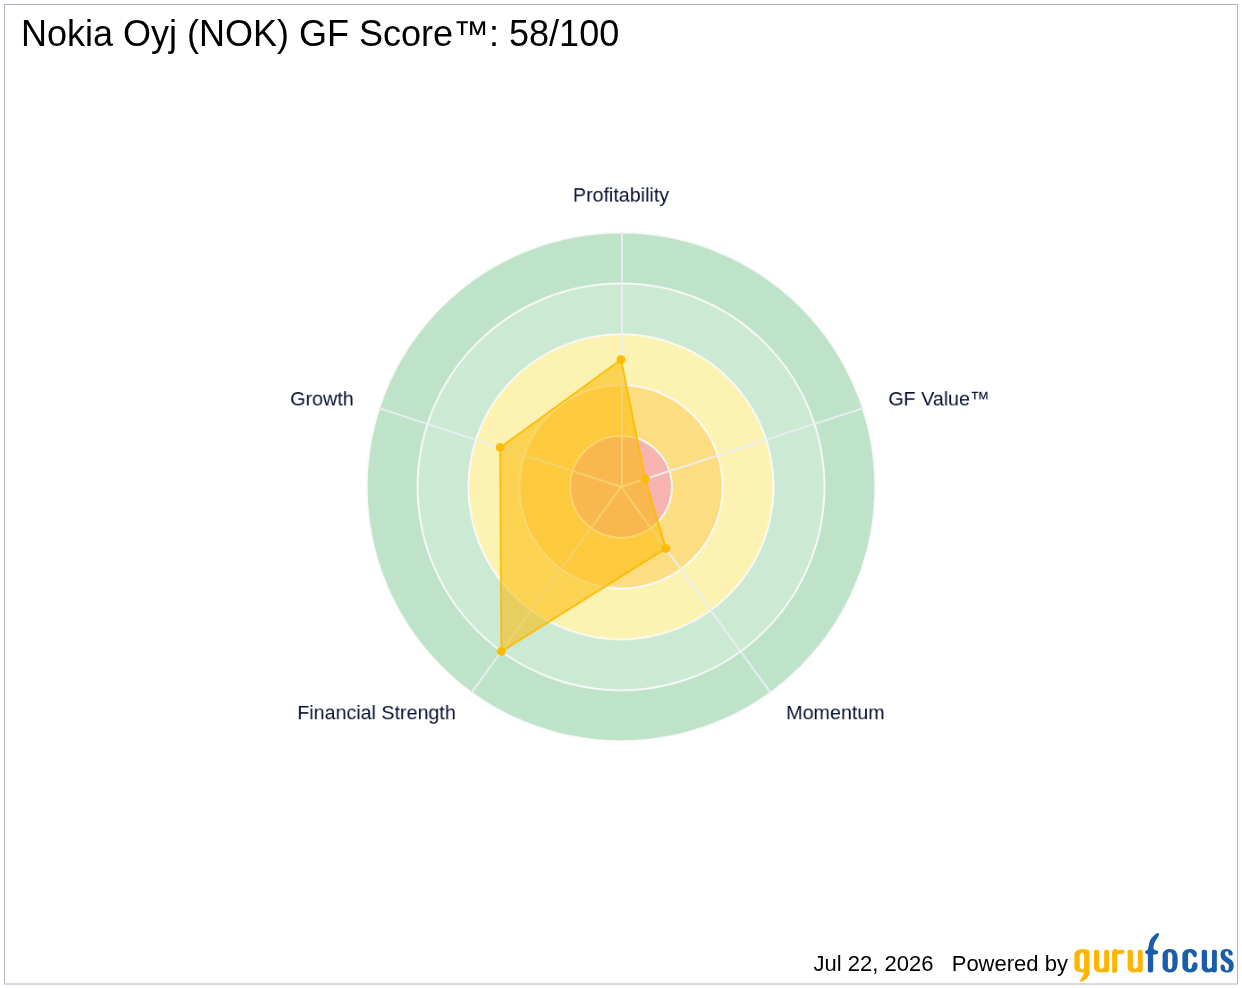
- GF Score™: 58/100, indicating average performance relative to peers
- Financial Strength: Strong financial position with a debt-to-equity ratio of 0.16
What's Behind the News?
Nokia's upcoming earnings report is significant as it reflects the company's ability to capitalize on the growing demand for advanced networking solutions. The surge in sales, particularly in the optical transport network segment, highlights the company's strategic focus on AI and cloud customers, which are becoming increasingly vital in today's digital economy. The raised revenue outlook for the Network Infrastructure segment is a positive indicator of Nokia's growth potential and adaptability in a rapidly evolving market.
Nokia Oyj is a leading telecommunications company specializing in networking equipment that supports wireless networks, Internet Protocol, and optical systems. With a market capitalization of approximately €58.1 billion, Nokia operates in the technology sector, specifically within the hardware industry. The company is known for its innovative solutions that cater to the world's largest telecommunication service providers, positioning itself as a key player in the global communications landscape.
How Is NOK Valued?
Currently, GF Value™ data is not available for Nokia stock. However, the company's P/E ratio stands at 59.46x, which is significantly higher than the historical median P/E ratio of 22.66x. This suggests that the stock may be overvalued relative to its earnings potential. Investors should consider this valuation context when assessing Nokia's stock performance. For more detailed information, visit the NOK stock page.
What Does NOK's GF Score™ Tell Us?
The GF Score™ ranks stocks from 0 to 100 based on five key aspects: Financial Strength, Profitability, Growth, Valuation, and Momentum. Stocks with higher GF Score™ values have been found to generate higher long-term returns (backtested 2006-2021).
| GF Score™ | 58 |
| Financial Strength | 8/10 |
| Profitability | 5/10 |
| Growth | 5/10 |
| Valuation | Significantly Overvalued |
Nokia's GF Score™ of 58 indicates that while the company has strong financial strength, it faces challenges in profitability and growth. The financial strength rating of 8/10 reflects a solid balance sheet, but the profitability and growth ranks of 5/10 suggest that there is room for improvement. Investors should weigh these factors when considering Nokia's long-term investment potential. For further insights, visit the NOK stock page.
What Are Insiders Doing with NOK Stock?
There has been no recent insider buying or selling activity reported for Nokia, indicating that insiders may currently be holding their positions.
What This Means for Investors
Given the current data, Nokia presents a mixed investment case. While the company shows strong financial strength and has raised its revenue outlook, its high P/E ratio and average GF Score™ suggest caution. Investors should carefully consider these factors before making any investment decisions. For the complete analysis, visit the NOK stock page. You can also use the GuruFocus Stock Screener to find similar opportunities.
Frequently Asked Questions
What is NOK's GF Score™?
NOK's GF Score™ is 58/100, indicating average performance relative to its peers based on various financial metrics.
How is NOK valued?
NOK has a P/E ratio of 59.46x, which is significantly higher than its historical median P/E ratio, suggesting that the stock may be overvalued.
What is NOK's P/E ratio compared to historical?
NOK's current P/E ratio of 59.46x is much higher than its 5-year median P/E ratio of 22.66x, indicating a potential overvaluation in the market.
This stock alert was generated using automated technology and GuruFocus financial data to provide readers with timely and accurate market reporting. This content was reviewed by GuruFocus editorial team prior to publication. Please send any questions or comments about this story to [email protected].

