


On July 22, 2026, MaxLinear Inc MXL is set to release its Q2 earnings after the market closes. Analysts are optimistic, projecting an earnings per share (EPS) of $0.33, which would represent a staggering year-over-year increase of 1550.0%. Additionally, revenue is expected to reach $164.66 million, reflecting a 51.3% rise compared to the previous year. Historically, MXL has exceeded EPS estimates 75% of the time and revenue estimates 88% of the time over the past two years. Notably, both EPS and revenue forecasts have experienced 11 upward revisions in the last three months.
- Market Cap: $7.77 billion
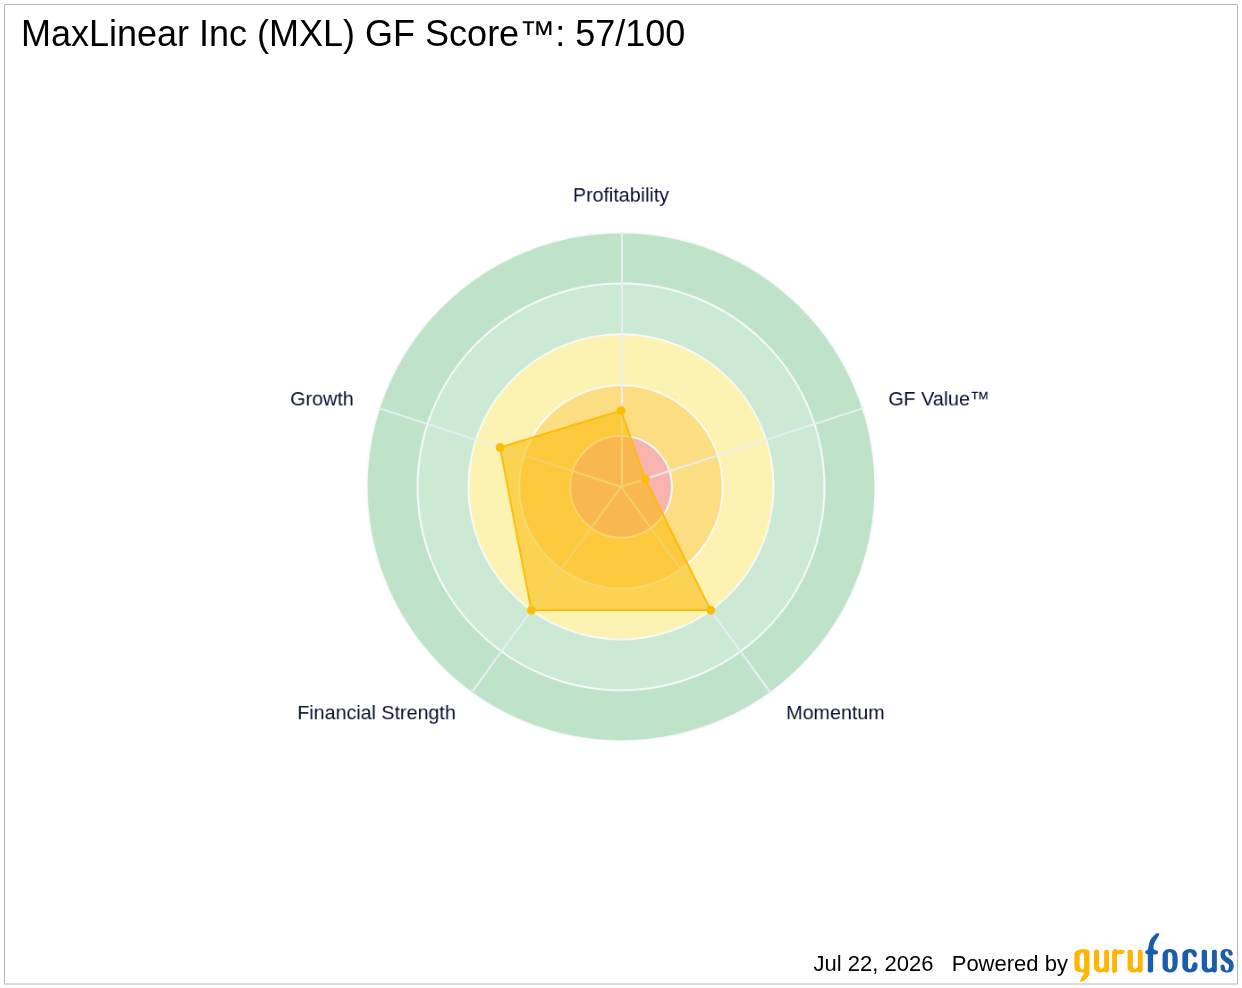
- GF Score™: 57/100, indicating moderate performance relative to peers
- Insider Activity: $8.9 million in shares sold over the past three months
What's Behind the News?
The upcoming earnings release is significant for MaxLinear as it reflects the company's recovery trajectory and growth potential in the semiconductor industry. The anticipated EPS and revenue growth signals strong operational performance and market demand for its products, which include radio frequency and mixed-signal integrated circuits essential for broadband communications and data center applications. Given the company's history of surpassing estimates, investors are keenly awaiting the results to gauge future performance.
MaxLinear Inc operates within the technology sector, specifically in the semiconductor industry, with a market capitalization of approximately $7.77 billion. The company specializes in providing integrated circuits that facilitate broadband communications and data transport networks. Its products are critical for various applications, including cable and satellite broadband communications, making it a key player in the expanding connected home and data center markets.
How Is MXL Valued?
Currently, GF Value™ data is not available for MaxLinear. However, the company has a price-to-sales (P/S) ratio of 14.9, which is significantly higher than the median P/S ratio of 3.68 for its industry. This suggests that MXL may be overvalued relative to its peers, especially considering the historical context of its financial performance. For more detailed valuation insights, visit the MXL stock page.
What Does MXL's GF Score™ Tell Us?
The GF Score™ ranks stocks from 0 to 100 based on five key aspects: Financial Strength, Profitability, Growth, Valuation, and Momentum. Stocks with higher GF Score™ values have been found to generate higher long-term returns (backtested 2006-2021).
| GF Score™ | 57 |
| Financial Strength | 6/10 |
| Profitability | 3/10 |
| Growth | 5/10 |
| Valuation | Significantly Overvalued |
MaxLinear's GF Score™ of 57 indicates a moderate performance, with strengths in financial strength but weaknesses in profitability. The company has a solid Altman Z-score of 13.97, suggesting strong financial stability, but its profitability rank of 3/10 indicates challenges in generating consistent profits. For further insights, visit the MXL stock page.
What Are Insiders Doing with MXL Stock?
In terms of insider activity, there have been significant sales, with insiders selling $8.9 million worth of shares over the past three months. This trend raises questions about the confidence of insiders in the company's future performance, as no insider purchases have been reported during this period.
What This Means for Investors
Investors should approach MaxLinear with caution, given the mixed signals from its GF Score™ and insider selling activity. While the company shows potential for growth and has a strong financial position, the high valuation metrics and lack of insider buying may warrant further scrutiny.
For the complete analysis, visit the MXL stock page. You can also use the GuruFocus Stock Screener to find similar opportunities.
Frequently Asked Questions
What is MXL's GF Score™?
MXL's GF Score™ is 57/100, indicating a moderate performance relative to its peers in the semiconductor industry.
How is MXL valued?
MXL has a price-to-sales (P/S) ratio of 14.9, which is significantly higher than the median P/S ratio of 3.68 for its industry, suggesting it may be overvalued.
What is MXL's P/E ratio compared to historical?
MXL currently has no P/E ratio available, indicating it may not be generating profits consistently. However, its financial strength is highlighted by a strong Altman Z-score of 13.97.
This stock alert was generated using automated technology and GuruFocus financial data to provide readers with timely and accurate market reporting. This content was reviewed by GuruFocus editorial team prior to publication. Please send any questions or comments about this story to [email protected].

