


On July 23, 2026, ServiceNow Inc NOW reported a significant 23% increase in subscription revenue for Q2 2026, amounting to $3.877 billion. This performance reflects the company's strong operational efficiency and growth potential.
- Market Cap: Approximately $98.45 billion, indicating a robust position in the technology sector.
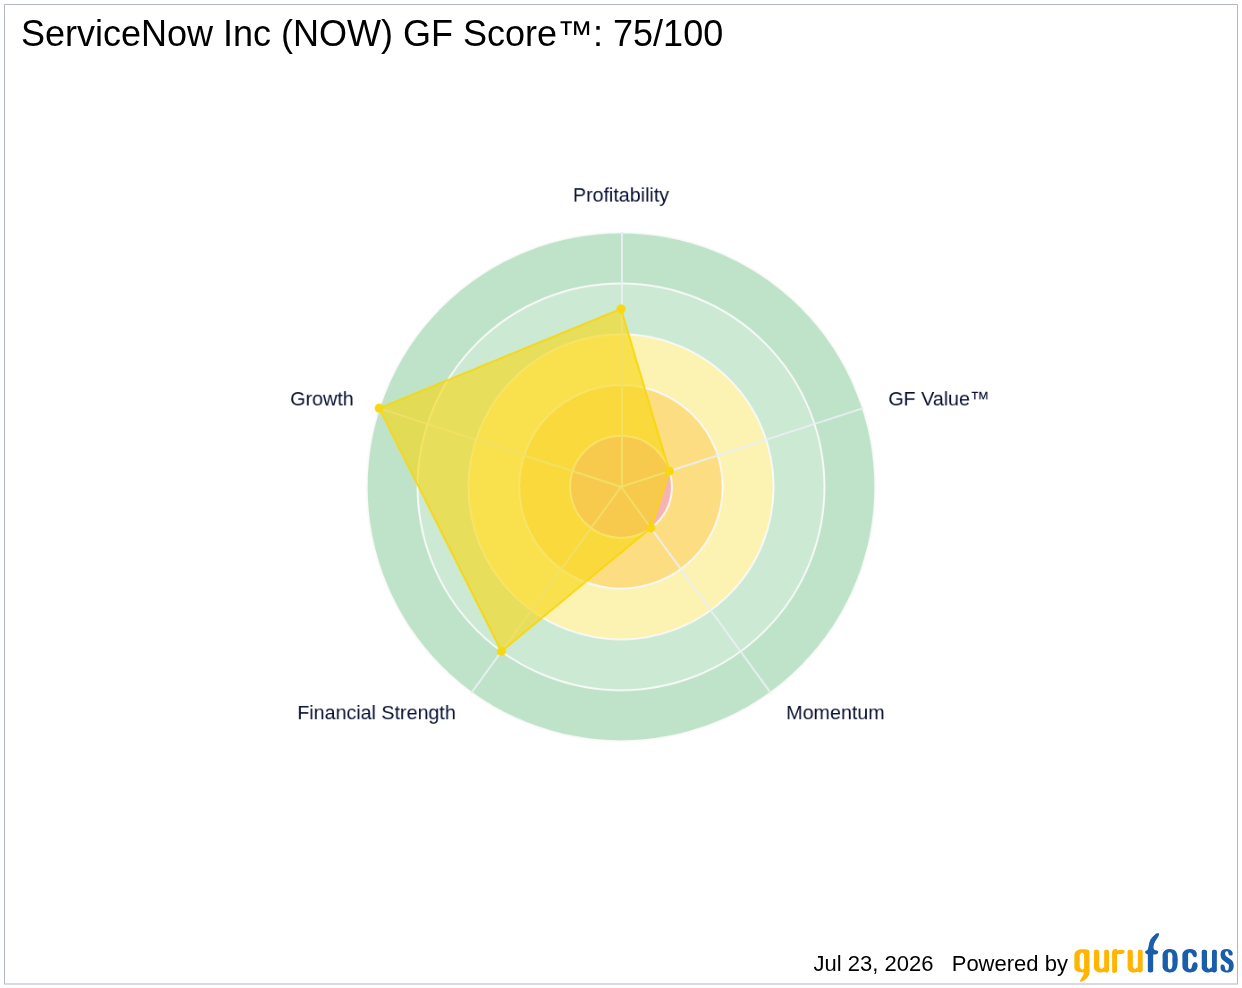
- GF Score™: 75/100, suggesting a solid investment potential based on GuruFocus' proprietary metrics.
- Financial Strength: Rated 8/10, highlighting the company's strong financial position.
What's Behind the News?
ServiceNow's impressive Q2 results are driven by a substantial rise in subscription revenue, which has been a key focus for the company as it continues to expand its cloud-based software solutions. The operating margin of 29.5% exceeded guidance by 3 percentage points, showcasing the company's ability to manage costs effectively while driving revenue growth. Furthermore, the annual contract value (ACV) from ServiceNow AI has surpassed $1 billion, positioning the company to potentially exceed its $1.5 billion ACV target by the end of 2026. The renewal rate of 98% further underscores the company's strong customer retention and satisfaction.
ServiceNow operates in the technology sector, specifically within the software industry, providing solutions that automate and structure various business processes through a SaaS delivery model. With a market capitalization of approximately $98.45 billion, ServiceNow is a significant player in the enterprise software market, focusing primarily on IT service management and expanding into areas such as customer service and HR service delivery.
How Is NOW Valued?
Currently, GF Value™ data is not available for ServiceNow. However, the company's P/E ratio stands at 56.89x, which may indicate a premium valuation compared to historical averages in the software industry. This high P/E ratio reflects investor expectations for continued growth and profitability. For more detailed valuation insights, visit the NOW stock page.
What Does NOW's GF Score™ Tell Us?
The GF Score™ ranks stocks from 0 to 100 based on five key aspects: Financial Strength, Profitability, Growth, Valuation, and Momentum. Stocks with higher GF Score™ values have been found to generate higher long-term returns (backtested 2006-2021).
| Metric | Rating |
|---|---|
| GF Score™ | 75 |
| Financial Strength | 8/10 |
| Profitability | 7/10 |
| Growth | 10/10 |
ServiceNow's strengths lie in its high growth potential, evidenced by a Growth Rank of 10/10, and strong financial health, with a Financial Strength rating of 8/10. However, the relatively high P/E ratio may suggest that the stock is priced for significant future growth, which could be a risk if the company fails to meet these expectations. For further insights, visit the NOW stock page.
What Are Insiders Doing with NOW Stock?
In the past three months, insiders have sold approximately $2.7 million worth of shares, with no purchases reported during this period. This level of insider selling could indicate a lack of confidence among executives regarding the stock's short-term performance.
What This Means for Investors
Based on the available data, ServiceNow demonstrates strong growth potential and solid financial strength, as reflected in its GF Score™ and financial metrics. However, the high P/E ratio and recent insider selling may warrant caution for potential investors. For the complete analysis, visit the NOW stock page. You can also use the GuruFocus Stock Screener to find similar opportunities.
Frequently Asked Questions
What is NOW's GF Score™?
NOW's GF Score™ is 75/100, indicating a solid investment potential based on various financial metrics.
How is NOW valued?
NOW has a P/E ratio of 56.89x, suggesting a premium valuation relative to historical averages in the software industry.
What is NOW's P/E ratio compared to historical?
NOW's current P/E ratio of 56.89x is significantly higher than the historical averages for the software sector, reflecting strong growth expectations from investors.
This stock alert was generated using automated technology and GuruFocus financial data to provide readers with timely and accurate market reporting. This content was reviewed by GuruFocus editorial team prior to publication. Please send any questions or comments about this story to [email protected].

