


On July 23, 2026, RTX Corporation RTX announced impressive financial results for Q2 2026, reporting adjusted sales of $24.7 billion, a 16% organic increase, and an adjusted EPS of $1.89. The company's free cash flow reached $2.9 billion, while its backlog hit a record $289 billion. RTX secured nearly $20 billion in awards, achieving a book-to-bill ratio of 2.42.
- RTX's current P/E ratio stands at 39.46x, indicating a premium valuation compared to historical averages.
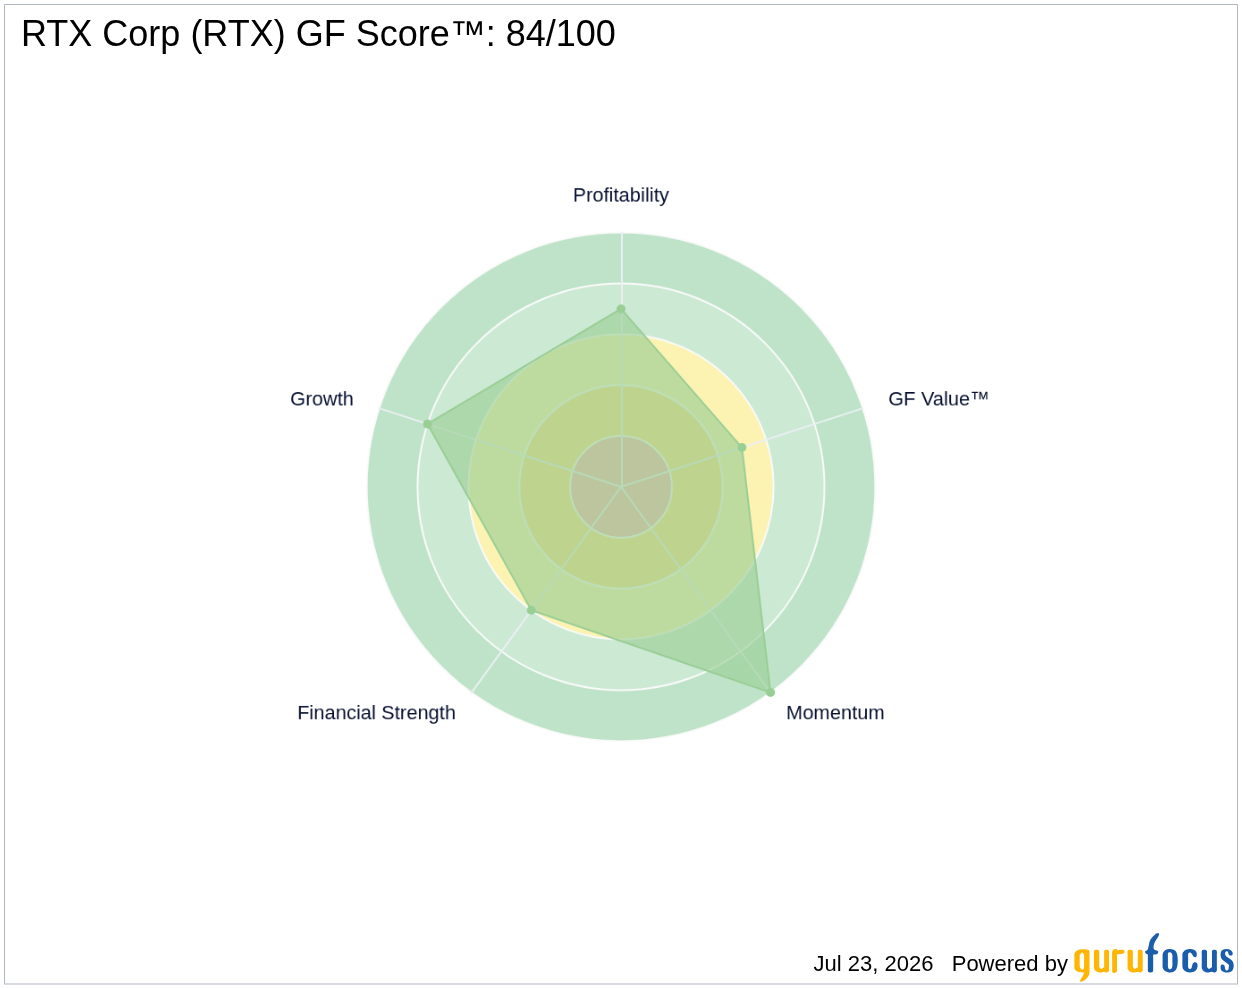
- GF Score™: 84/100, suggesting a strong overall performance relative to peers.
- Insider activity shows 15 sell transactions in the past 12 months, indicating some level of caution among insiders.
What's Behind the News?
The announcement of RTX's Q2 2026 financial results highlights the company's robust growth trajectory, particularly in the aerospace and defense sectors. The 16% organic sales increase and a record backlog of $289 billion indicate strong demand for RTX's products and services, which include commercial aerospace systems and defense technologies. The significant book-to-bill ratio of 2.42 further underscores the company's ability to secure new contracts, positioning it well for future growth.
RTX Corporation, formed from the merger of United Technologies and Raytheon, operates within the industrials sector, specifically in the aerospace and defense industry. With a market capitalization of approximately $283.21 billion, RTX has established itself as a key player in providing high-technology products and services across various segments, including Collins Aerospace and Pratt & Whitney. The company’s diversified portfolio allows it to cater to both commercial and military markets effectively.
How Is RTX Valued?
Currently, GF Value™ data is not available for RTX. However, the company's P/E ratio of 39.46x suggests that investors are willing to pay a premium for its earnings, reflecting confidence in its growth prospects. The forward P/E ratio is not specified, but the high P/E ratio indicates that the stock may be considered overvalued compared to historical norms. For more detailed information, visit the RTX stock page.
What Does RTX's GF Score™ Tell Us?
The GF Score™ ranks stocks from 0 to 100 based on five key aspects: Financial Strength, Profitability, Growth, Valuation, and Momentum. Stocks with higher GF Score™ values have been found to generate higher long-term returns (backtested 2006-2021).
| Metric | Rating |
|---|---|
| GF Score™ | 84 |
| Financial Strength | 6/10 |
| Profitability | 7/10 |
| Growth | 8/10 |
RTX's strengths lie in its high GF Score™ of 84, indicating strong growth and profitability ranks of 8/10 and 7/10, respectively. However, its financial strength is rated at 6/10, suggesting that while the company is performing well, there may be some concerns regarding its financial stability, as indicated by its Altman Z-Score of 2.77, which is in the grey area. For more insights, visit the RTX stock page.
What Are Insiders Doing with RTX Stock?
In the past 12 months, there have been 15 insider sell transactions, with a total sell value of approximately $43.86 million. This level of insider selling may indicate that insiders are taking profits or adjusting their positions, which could be a point of consideration for investors.
What This Means for Investors
RTX's strong Q2 results and high GF Score™ reflect a company that is performing well in a competitive industry. However, the high P/E ratio and insider selling activity may warrant caution for potential investors. The company's growth prospects remain promising, but investors should weigh these factors carefully. For the complete analysis, visit the RTX stock page. You can also use the GuruFocus Stock Screener to find similar opportunities.
Frequently Asked Questions
What is RTX's GF Score™?
RTX's GF Score™ is 84/100, indicating a strong overall performance relative to its peers.
How is RTX valued?
RTX's current P/E ratio is 39.46x, suggesting a premium valuation compared to historical averages.
What is RTX's P/E ratio compared to historical?
The current P/E ratio of 39.46x indicates that RTX is trading at a premium compared to its historical P/E ratios, reflecting investor confidence in its growth potential.
This stock alert was generated using automated technology and GuruFocus financial data to provide readers with timely and accurate market reporting. This content was reviewed by GuruFocus editorial team prior to publication. Please send any questions or comments about this story to [email protected].

