


On July 24, 2026, AlphaSense, a company providing AI-driven research and market analysis tools for banks and businesses, is preparing for an initial public offering (IPO) within the coming months. The company has achieved a valuation of $7.5 billion following its latest funding round, with an annual recurring revenue (ARR) surpassing $700 million and a year-over-year revenue increase of 40%.
- GF Value™ verdict: $89.10 vs Current Price $31.20 = 65.0% undervalued
- GF Score™ 84/100 indicating strong overall performance
- Key financial signal: P/E (TTM) of 16.51x compared to a 5-Year Median P/E of 19.34x
What's Behind the News?
AlphaSense's impending IPO is significant as it reflects the growing demand for AI-driven solutions in the financial sector. The company has positioned itself as a leader in providing advanced market analysis tools that leverage artificial intelligence, which is crucial for banks and businesses looking to enhance their research capabilities. The recent valuation of $7.5 billion underscores investor confidence in AlphaSense's growth trajectory, especially as it navigates a competitive landscape with firms like OpenAI and Anthropic.
Founded 15 years ago, AlphaSense has carved a niche in the technology sector, specifically within the AI-driven research and analytics industry. With a robust ARR exceeding $700 million, the company is well-positioned to capitalize on the increasing reliance on data-driven insights in business decision-making. The transition to a usage-based revenue model further reflects the rising demand for its innovative AI features, making it a compelling player in the market.
Is SMCI Overvalued or Undervalued?
According to GuruFocus, SMCI's GF Value™ is calculated at $89.10, while its current trading price is $31.20, indicating that the stock is undervalued by approximately 65.0%. This significant margin of safety suggests that investors may have an opportunity to acquire shares at a price well below their intrinsic value. The P/E (TTM) ratio stands at 16.51x, which is notably lower than its 5-year median P/E of 19.34x, indicating that the stock may be undervalued relative to its historical performance. For more insights, visit the GF Value™ page.
What Does SMCI's GF Score™ Tell Us?
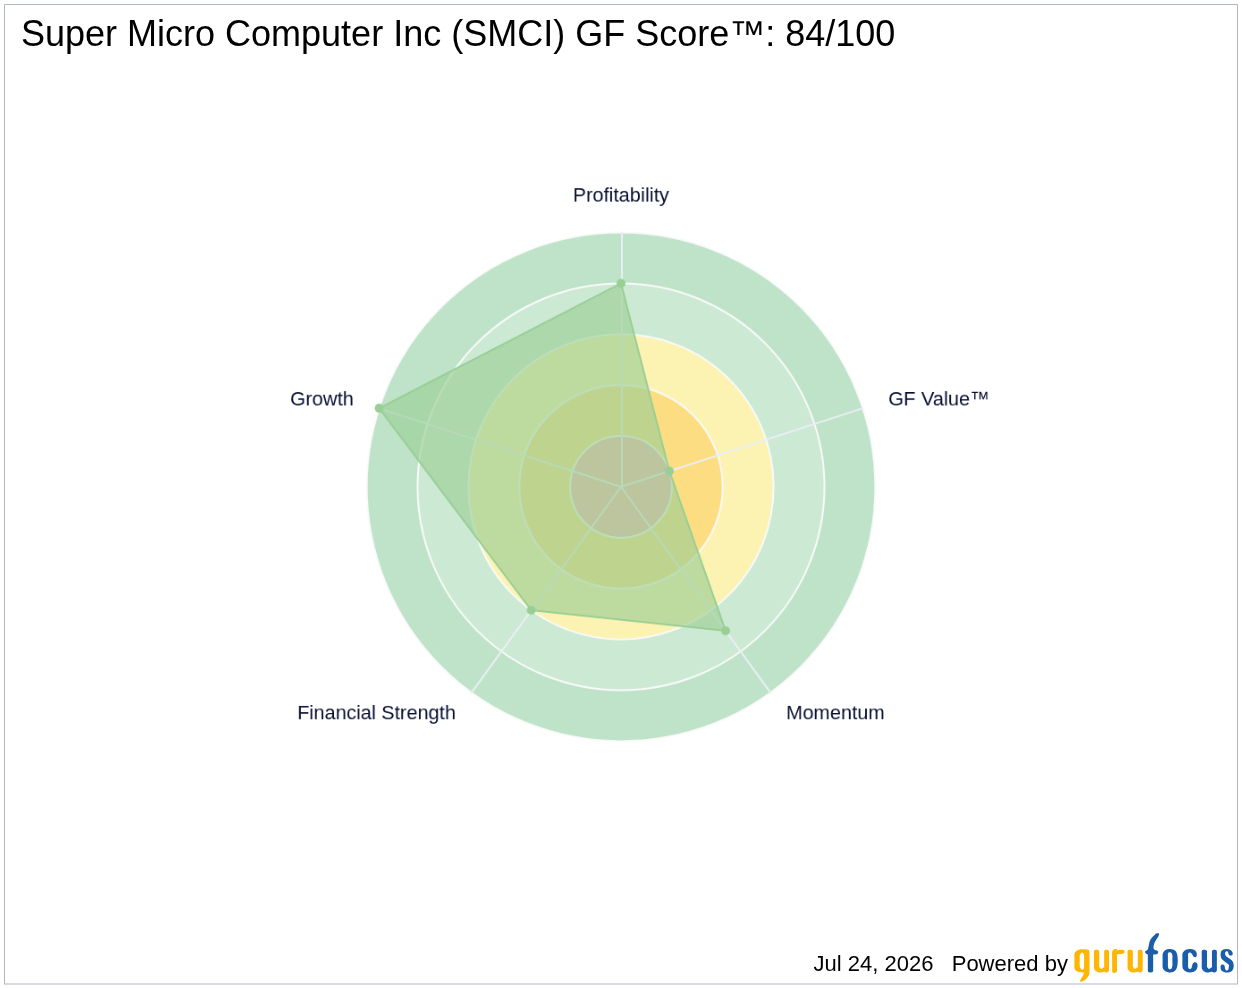
The GF Score™ ranks stocks from 0 to 100 based on five key aspects: Financial Strength, Profitability, Growth, Valuation, and Momentum. Stocks with higher GF Score™ values have been found to generate higher long-term returns (backtested 2006-2021).
| Metric | Rating |
|---|---|
| GF Score™ | 84 |
| Financial Strength | 6/10 |
| Profitability | 8/10 |
| Growth | 10/10 |
| Valuation | 2/10 |
| Momentum | 7/10 |
SMCI's strengths lie in its impressive growth rank of 10/10 and solid profitability rank of 8/10, indicating robust business performance. However, its valuation rank of 2/10 suggests caution, as the stock may be perceived as a possible value trap. For further details, visit the SMCI stock page.
What Are Insiders Doing with SMCI Stock?
There has been no insider buying or selling activity reported in the last three months, indicating a potential lack of confidence or uncertainty among insiders regarding the stock's future performance.
What This Means for Investors
Based on the available data, SMCI appears to be significantly undervalued according to GF Value™, with a strong GF Score™ indicating solid growth and profitability metrics. However, potential investors should be cautious due to the low valuation rank, which suggests that the stock may be a possible value trap.
For the complete analysis, visit the SMCI stock page. You can also use the GuruFocus Stock Screener to find similar opportunities.
Frequently Asked Questions
What is SMCI's GF Score™?
SMCI's GF Score™ is 84/100, indicating strong overall performance across key financial metrics.
Is SMCI overvalued or undervalued?
SMCI is currently undervalued, with a GF Value™ of $89.10 compared to its current price of $31.20, suggesting a 65.0% undervaluation.
What is SMCI's P/E ratio compared to historical?
SMCI's P/E (TTM) is 16.51x, which is lower than its 5-year median P/E of 19.34x, indicating potential undervaluation based on historical performance.
This stock alert was generated using automated technology and GuruFocus financial data to provide readers with timely and accurate market reporting. This content was reviewed by GuruFocus editorial team prior to publication. Please send any questions or comments about this story to [email protected].

