


On July 24, 2026, we delve into the DCF analysis for HDFC Bank Ltd HDB, a company currently facing significant price performance challenges, with a year-to-date decline of 35.6% and a one-year drop of 39.6%. Below are key insights from our analysis:
- DCF Earnings-based intrinsic value of $42.85 compared to the current price of $23.13, indicating a margin of safety of 29.7%.
- DCF Free Cash Flow (FCF)-based intrinsic value of $62.19, providing a second opinion that suggests the stock is significantly undervalued with a margin of safety of 62.8%.
- GF Score™ of 73/100, indicating a moderate level of reliability in the DCF inputs.
What Is HDB Worth? DCF Earnings-Based Model
The DCF earnings-based model utilizes a two-stage approach to estimate the intrinsic value of HDFC Bank Ltd. In the first stage, we project the earnings growth over the next ten years, followed by a terminal growth phase. The assumptions used in this model are crucial for accuracy.
| Parameter | Value |
|---|---|
| Current EPS (TTM, excl. non-recurring) | $1.58 |
| 10-Year Growth Rate | 17.9% |
| 10-Year Treasury Rate | 4.68% |
| Discount Rate (ceil(Treasury) + 6%) | 11% |
| Terminal Growth Rate | 4% |
In the growth phase, we anticipate that HDB's EPS will grow at a rate of 17.9% annually for the first ten years, which is then discounted at a rate of 11%. The terminal phase assumes a slowdown to a 4% growth rate for the subsequent ten years. Below is a summary of the calculations:
| Stage | Description | Value |
|---|---|---|
| Growth Stage (Years 1-10) | EPS growing at 17.9%, discounted at 11% | $22.33 |
| Terminal Stage (Years 11-20) | 4% terminal growth, discounted at 11% | $20.52 |
| Intrinsic Value | Growth + Terminal | $42.85 |
Comparing the current price of $23.13 against the intrinsic value of $32.90 reveals that HDB is modestly undervalued, with a margin of safety of 29.7%. It is important to note that GuruFocus uses EPS without non-recurring items, as research indicates that stock prices correlate more closely with earnings than with free cash flow. For further details, you can visit the HDB DCF Calculator.
What Does the Free Cash Flow DCF Say?
The Free Cash Flow (FCF)-based intrinsic value for HDB stands at $62.19. This value significantly exceeds the earnings-based intrinsic value of $42.85, suggesting a strong divergence in valuation perspectives. The FCF model indicates that HDB is significantly undervalued, with a margin of safety of 62.8%.
How Does GF Value™ Compare to the DCF Models?
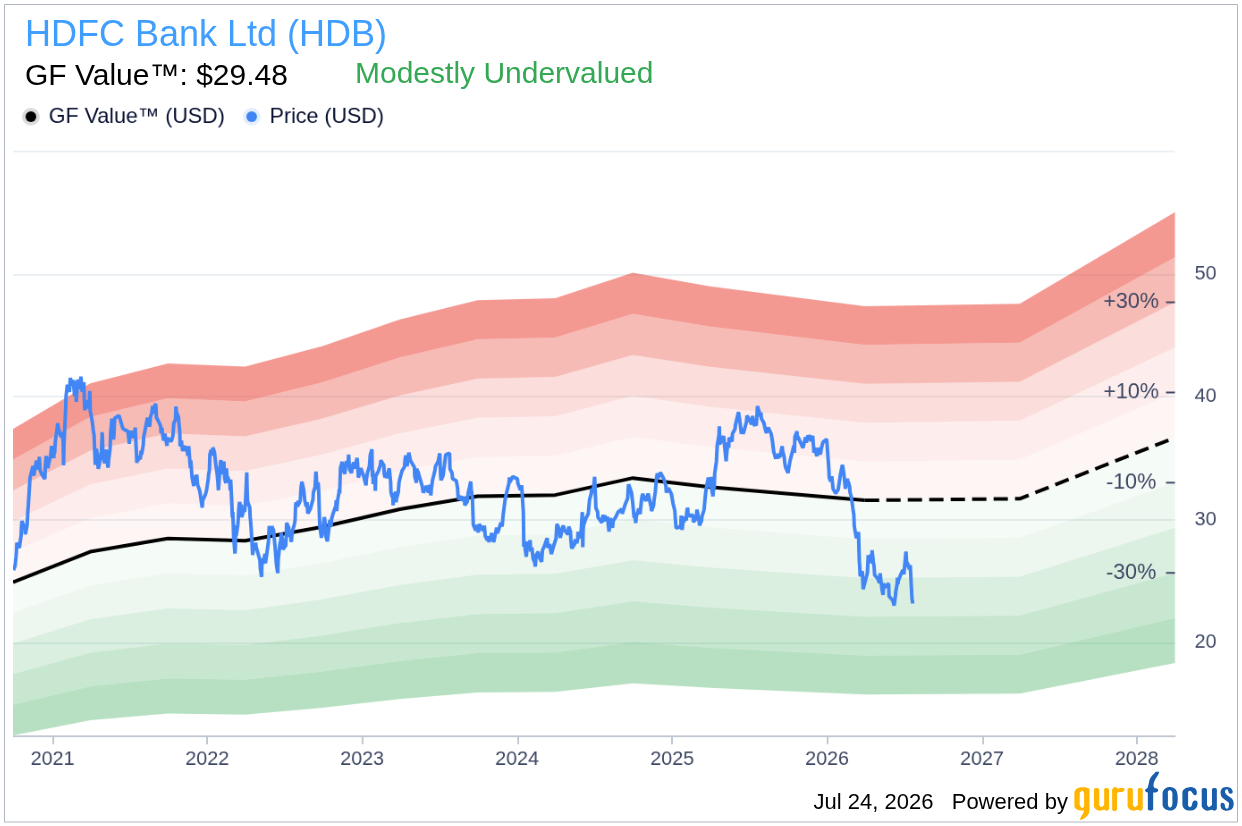
The GF Value™ for HDB is calculated at $29.48, providing a third perspective on valuation. GF Value™ is GuruFocus' proprietary measure, derived from historical trading multiples, past business growth, and future performance estimates. All three models—DCF earnings, DCF FCF, and GF Value™—suggest that HDB is undervalued, reinforcing the case for potential upside in the stock's price. For more information, visit the GF Value™ page.
What Does HDB's GF Score™ Tell Us?
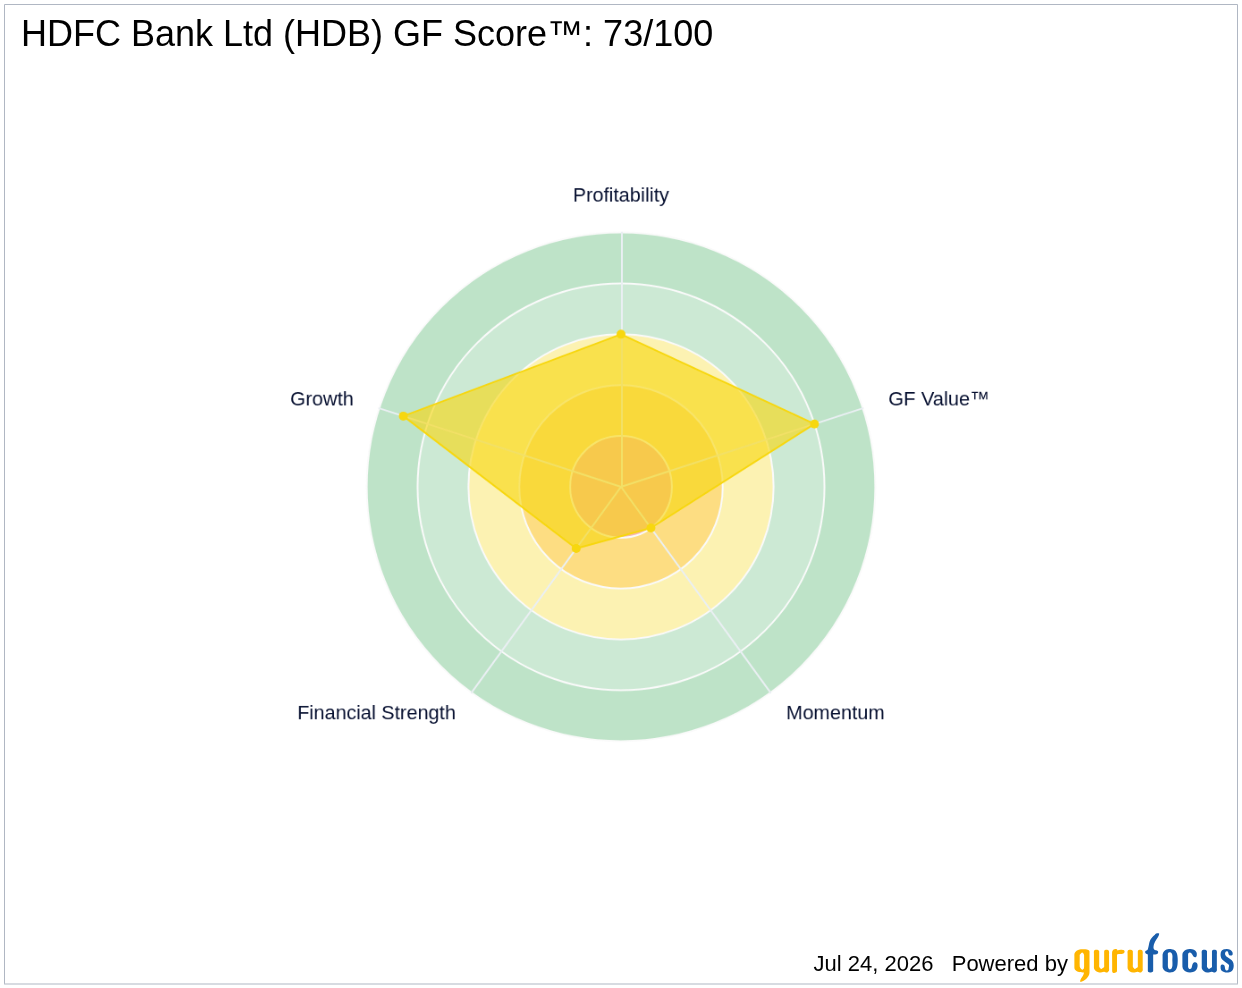
The GF Score™ ranks stocks from 0 to 100 based on five key aspects: Financial Strength, Profitability, Growth, Valuation, and Momentum. Stocks with higher GF Score™ values have historically generated higher long-term returns (backtested from 2006-2021). Below is a summary of HDB's GF Score™ metrics:
| Metric | Rating |
|---|---|
| GF Score™ | 73/100 |
| Financial Strength | 3/10 |
| Profitability | 6/10 |
| Growth | 9/10 |
| Valuation | 8/10 |
| Momentum | 2/10 |
With a predictability rank of 2/5 stars, it indicates that the DCF model's reliability for HDB may be limited. For more insights, visit the HDB stock page.
Key Assumptions and Limitations
It is essential to recognize that DCF models are highly sensitive to the assumptions made regarding growth rates and discount rates. Stocks with low predictability ratings, such as HDB, produce less reliable DCF estimates. Additionally, the terminal growth rate of 4% is a simplifying assumption that may not fully capture future economic conditions.
What This Means for Investors
In synthesizing the three valuation models—DCF earnings, DCF FCF, and GF Value™—it is clear that HDB presents a compelling case for being undervalued. The earnings-based model suggests a modest undervaluation, while the FCF model indicates a more significant undervaluation. The GF Value™ also supports this perspective.
For the full DCF analysis, visit the HDB DCF Calculator. You can also explore the GF Value™ page, or use the GuruFocus Stock Screener to find undervalued predictable companies.
Frequently Asked Questions
What is HDB's intrinsic value based on DCF?
HDB's intrinsic value based on the DCF earnings model is $32.90, while the FCF-based intrinsic value is $62.19.
Is HDB overvalued or undervalued?
Based on the DCF earnings model, HDB is modestly undervalued, while the FCF model indicates it is significantly undervalued. The GF Value™ also supports the undervaluation perspective.
How reliable is the DCF model for HDB?
The reliability of the DCF model for HDB is limited, as indicated by its predictability rank of 2/5 stars.
This stock alert was generated using automated technology and GuruFocus financial data to provide readers with timely and accurate market reporting. This content was reviewed by GuruFocus editorial team prior to publication. Please send any questions or comments about this story to [email protected].

