


On July 24, 2026, U.S. credit card delinquencies experienced a slight rise to 2.48%, up from 2.47% in May, while the average net charge-off rate decreased to 3.42%. This news is particularly relevant for American Express Co AXP, a major player in the credit services industry.
- American Express has a market capitalization of approximately $220.12 billion.
- GF Score™: 80/100, indicating strong potential for long-term returns.
- Insider activity shows a sell of $2.4 million over the past three months, suggesting caution among insiders.
What's Behind the News?
The recent rise in credit card delinquencies, although slight, is a noteworthy indicator of consumer financial health and can impact companies like American Express that operate in the credit services sector. The increase to 2.48% is still below the three-month average of 2.50%, which may suggest that while there are signs of stress in consumer credit, the overall trend remains stable. Conversely, the decline in the net charge-off rate to 3.42% indicates that fewer debts are being written off as uncollectible, which is a positive sign for credit card issuers.
American Express Co is a global financial institution that provides charge and credit card payment products to consumers and businesses across approximately 130 countries. With a market cap of $220.12 billion, the company operates in various segments, including U.S. consumer services, U.S. commercial services, international card services, and global merchant and network services. The company has shown consistent revenue growth, with a three-year revenue growth rate of 13.9% and a strong net margin of 15.13%.
How Is AXP Valued?
Currently, GF Value™ data is not available for American Express. However, the stock is valued with a P/E ratio of 20.12, which is a critical metric for assessing its valuation relative to earnings. This P/E ratio indicates that investors are willing to pay $20.12 for every dollar of earnings, which can be compared to historical averages to gauge whether the stock is overvalued or undervalued. For more detailed information, visit the AXP stock page.
What Does AXP's GF Score™ Tell Us?
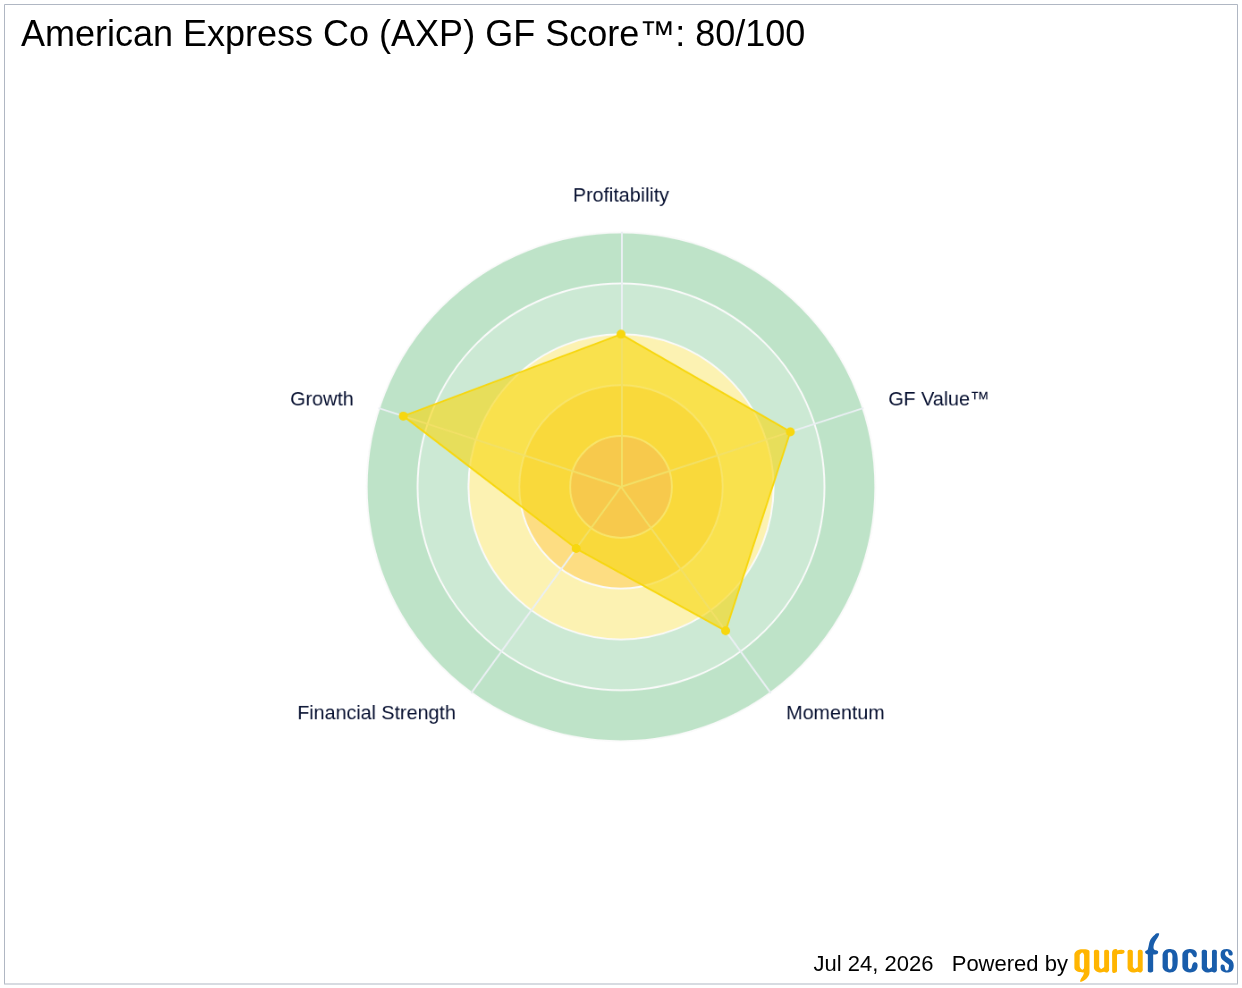
The GF Score™ ranks stocks from 0 to 100 based on five key aspects: Financial Strength, Profitability, Growth, Valuation, and Momentum. Stocks with higher GF Score™ values have been found to generate higher long-term returns (backtested 2006-2021).
| Metric | Rating |
|---|---|
| GF Score™ | 80 |
| Financial Strength | 3/10 |
| Profitability | 6/10 |
| Growth | 9/10 |
American Express demonstrates a strong GF Score™ of 80, indicating solid growth potential and profitability. However, its financial strength is rated lower at 3 out of 10, suggesting that the company may have some challenges related to debt levels. The growth rank of 9 out of 10 highlights the company's ability to expand its revenue consistently. For further insights, visit the AXP stock page.
What Are Insiders Doing with AXP Stock?
In the past three months, insiders have sold $2.4 million worth of shares, indicating a potential lack of confidence among company executives regarding the stock's near-term performance. Notably, there have been no insider purchases during this period, which may raise some concerns for investors.
What This Means for Investors
The current data suggests that while American Express has strong growth potential and profitability, its financial strength is a concern due to its high debt levels. Investors should weigh these factors carefully when considering their positions in AXP. For the complete analysis, visit the AXP stock page. You can also use the GuruFocus Stock Screener to find similar opportunities.
Frequently Asked Questions
What is AXP's GF Score™?
AXP's GF Score™ is 80/100, indicating strong potential for long-term returns based on various financial metrics.
How is AXP valued?
American Express has a P/E ratio of 20.12, which is a key metric for assessing its valuation relative to earnings.
What is AXP's P/E ratio compared to historical?
The current P/E ratio of 20.12 suggests that investors are valuing AXP at a premium compared to historical averages, but without historical P/E data, a direct comparison cannot be made.
This stock alert was generated using automated technology and GuruFocus financial data to provide readers with timely and accurate market reporting. This content was reviewed by GuruFocus editorial team prior to publication. Please send any questions or comments about this story to [email protected].

