


On July 27, 2026, Capricor Therapeutics Inc (NASDAQ: CAPR) saw its stock price plunge sharply by $12.47, or 63%, closing early trading at $7.23. This dramatic decline followed the release of FDA briefing documents ahead of a key advisory committee meeting scheduled for July 29, which raised significant questions about the efficacy and safety of Capricor’s lead treatment candidate.
- Market Cap: $387 million, reflecting a distressed valuation amid recent volatility
- GF Score™: 28/100, indicating considerable challenges in financial and operational metrics
- Insider Activity: $3.1 million in insider selling over the past three months, signaling cautious insider sentiment
What's Behind the News?
The recent sharp drop in Capricor Therapeutics’ stock price was triggered by the FDA’s release of briefing documents for the upcoming Cellular, Tissue, and Gene Therapies Advisory Committee meeting. The committee will review Biologics License Application (BLA) 125842, which Capricor resubmitted for deramiocel, an allogeneic cardiac-derived cell therapy aimed at treating cardiomyopathy in male patients with Duchenne muscular dystrophy (DMD). The FDA staff expressed concerns that the clinical evidence from pivotal studies HOPE-3 and HOPE-2 does not convincingly demonstrate deramiocel’s efficacy in this patient population. Additionally, safety issues, including serious hypersensitivity reactions, were highlighted, casting doubt on the treatment’s benefit-risk profile and suggesting a challenging regulatory path without stronger evidence.
Capricor Therapeutics Inc is a clinical-stage biotechnology company specializing in transformative cell and exosome-based therapies targeting rare diseases with high unmet medical needs, particularly Duchenne muscular dystrophy. The company’s product pipeline includes CAP-1002 and deramiocel, both in advanced clinical development stages. Operating within the healthcare sector and biotechnology industry, Capricor currently holds a market capitalization of $387 million. Despite its innovative focus, the company faces significant hurdles in demonstrating clinical efficacy and securing regulatory approval, which has materially impacted investor confidence.
How Is CAPR Valued?
Currently, GF Value™ data is not available for Capricor Therapeutics, limiting direct valuation comparisons based on GuruFocus’ proprietary metrics. The company’s trailing twelve-month price-to-earnings (P/E) ratio is not meaningful due to negative earnings, with a reported EPS of -2.32. The forward P/E ratio stands at 55.76, reflecting high expectations relative to current earnings but also significant uncertainty given the clinical and regulatory challenges. The price-to-book (P/B) ratio is 1.38, which is moderate but does not fully capture the risk profile. CAPR’s stock has experienced extreme volatility, with a 52-week trading range between $4.30 and $40.37, and a year-to-date price decline of 76.84%, underscoring the market’s reassessment of the company’s prospects.
For more detailed valuation metrics and historical data, visit the CAPR stock page.
What Does CAPR's GF Score™ Tell Us?
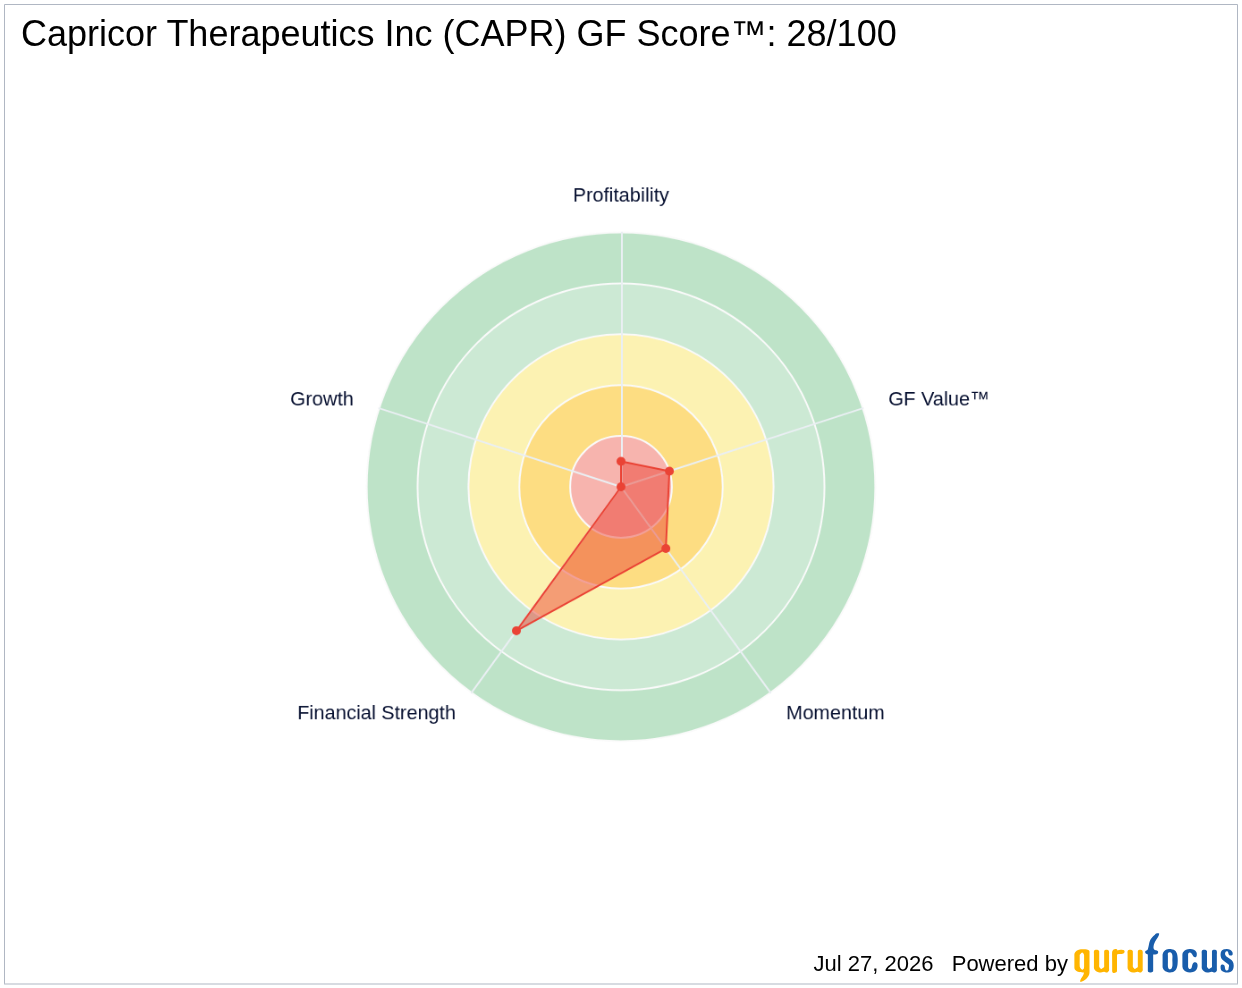
The GF Score™ is a composite rating from 0 to 100 that evaluates a stock across five key dimensions: Financial Strength, Profitability, Growth, Valuation, and Momentum. Higher GF Score™ values have historically correlated with stronger long-term returns based on backtesting from 2006 to 2021. Capricor Therapeutics’ GF Score™ is 28/100, reflecting significant weaknesses in several critical areas.
| Metric | Rating |
|---|---|
| GF Score™ | 28/100 |
| Financial Strength | 7/10 |
| Profitability | 1/10 |
| Valuation | 2/10 |
| Momentum | 3/10 |
Capricor’s relatively moderate Financial Strength score of 7/10 indicates a stable balance sheet, supported by a low debt-to-equity ratio of 0.05 and a strong interest coverage ratio of 9999, suggesting the company comfortably covers its debt obligations. However, the company’s Profitability rank is extremely low at 1/10, reflecting ongoing losses with a negative return on equity (ROE) of -63.59% and return on assets (ROA) of -52.28%. Valuation and Momentum ranks are also weak, consistent with the recent steep decline in stock price and lack of positive earnings growth. Overall, the GF Score™ highlights Capricor’s financial stability but underscores significant operational and market challenges.
For further insights, visit the CAPR stock page.
What Are Insiders Doing with CAPR Stock?
Insider activity over the past three months shows a net selling trend, with insiders offloading approximately $3.1 million worth of shares and no insider purchases reported. Specifically, there were six insider selling transactions and zero insider buying transactions during this period. This insider selling may reflect cautious sentiment among company executives and insiders amid regulatory uncertainties and stock price volatility.
What This Means for Investors
The FDA’s critical briefing documents and the subsequent advisory committee meeting represent a pivotal moment for Capricor Therapeutics. The lack of convincing clinical evidence and safety concerns for deramiocel have triggered a severe market reaction, reflected in the 63% stock price drop and poor GF Score™. While the company maintains a solid financial foundation with low debt and strong liquidity ratios, its profitability and valuation metrics remain weak, and insider selling activity suggests limited confidence from internal stakeholders. Investors should carefully monitor upcoming regulatory developments and clinical data updates before considering exposure to CAPR.
For the complete analysis, visit the CAPR stock page. You can also use the GuruFocus Stock Screener to find similar opportunities.
Frequently Asked Questions
What is CAPR's GF Score™?
CAPR’s GF Score™ is 28 out of 100, indicating significant challenges in profitability, valuation, and momentum despite moderate financial strength.
How is CAPR valued?
CAPR lacks a meaningful trailing P/E ratio due to negative earnings, with a forward P/E of 55.76 and a P/B ratio of 1.38, reflecting high uncertainty and a distressed valuation environment.
What is CAPR's P/E ratio compared to historical?
CAPR currently does not have a meaningful trailing P/E ratio because of ongoing losses, highlighting the company’s unprofitable status and financial challenges.
This stock alert was generated using automated technology and GuruFocus financial data to provide readers with timely and accurate market reporting. This content was reviewed by GuruFocus editorial team prior to publication. Please send any questions or comments about this story to [email protected].

