


On July 27, 2026, HDFC Bank Ltd (NYSE: HDB) announced penalties for three senior executives, including CEO Sashidhar Jagdishan, following an internal review of a questionable deposit arrangement with a state firm. The investigation concluded the actions were business overreach rather than misconduct, resulting in warnings and fines of 100,000 Indian rupees ($1,042) each. The stock reacted mildly, closing down 0.4% in Bombay and falling 0.3% in U.S. morning trading.
- GF Value™ verdict: Current price $23.19 vs GF Value™ $31.51, indicating the stock is 26.4% undervalued
- GF Score™: 73/100, reflecting a solid overall quality and valuation profile
- Key financial signal: Insider selling activity of approximately $0.1 million over the past three months
What's Behind the News?
The recent disciplinary action at HDFC Bank centers on an internal review of a deposit arrangement with a state-owned firm that raised concerns about business overreach by senior management. The bank’s investigation determined that while the executives’ actions were not misconduct, they exceeded the bank’s business boundaries. As a result, CEO Sashidhar Jagdishan and two other senior executives received formal warnings and fines of 100,000 Indian rupees each. This development has drawn investor attention, though the market reaction was relatively muted with a slight dip in share price.
HDFC Bank Ltd is a leading financial services company in India, operating primarily in the banking sector. It offers a broad range of services including retail banking, wholesale banking, treasury operations, and digital banking. The company’s market capitalization stands at $119.08 billion, making it one of the largest banks in the region. Its business segments cater predominantly to the domestic market, with products spanning personal loans, car loans, business loans, and digital banking services. The bank’s diversified operations and strong market presence underpin its significant role in India’s financial ecosystem.
Is HDB Overvalued or Undervalued?
According to GuruFocus’ proprietary GF Value™ metric, HDFC Bank’s stock is modestly undervalued by approximately 26.4%. The current trading price of $23.19 is well below the GF Value™ of $31.51, suggesting a margin of safety for investors considering the company’s historical trading multiples, growth prospects, and future earnings potential. This undervaluation indicates that the market may be pricing in some near-term uncertainties or risks, such as the recent executive penalties, but the intrinsic value remains robust.
Looking at valuation multiples, HDFC Bank’s trailing twelve months (TTM) price-to-earnings (P/E) ratio stands at 14.69x, which is significantly lower than its 5-year median P/E of 19.96x. This further supports the view that the stock is trading at a discount relative to its historical earnings valuation. The forward P/E ratio is currently not available, which may reflect some uncertainty about near-term earnings forecasts. Investors seeking a deeper dive into valuation metrics and intrinsic value calculations can refer to the GF Value™ page for HDB.
What Does HDB's GF Score™ Tell Us?
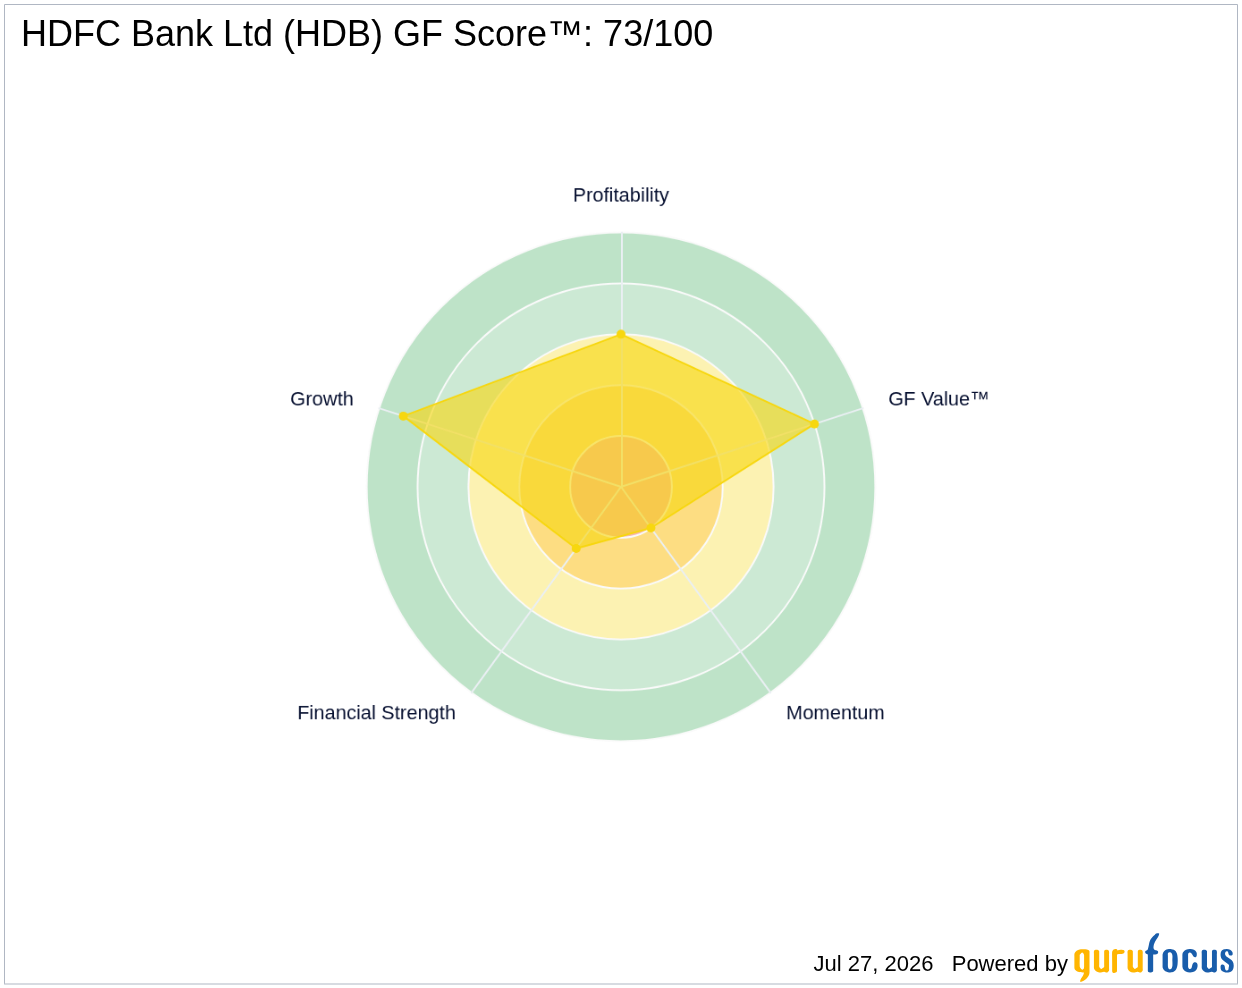
The GF Score™ is a comprehensive rating system that evaluates stocks on a scale from 0 to 100 based on five critical dimensions: Financial Strength, Profitability, Growth, Valuation, and Momentum. A higher GF Score™ generally correlates with stronger long-term returns, as demonstrated by backtesting from 2006 to 2021. HDFC Bank’s GF Score™ of 73/100 indicates a solid overall profile, with particular strengths and some areas for caution.
| Metric | Rating |
|---|---|
| GF Score™ | 73/100 |
| Financial Strength | 3/10 (Poor) |
| Profitability | 6/10 |
| Growth | 9/10 |
| Valuation | 8/10 |
| Momentum | 2/10 |
HDFC Bank’s strongest attributes lie in its growth and valuation ranks, scoring 9/10 and 8/10 respectively, reflecting consistent revenue and earnings growth alongside a favorable valuation relative to history. Profitability is moderate at 6/10, supported by a net margin of 36.63%, which is above the industry median. However, the bank’s financial strength is rated poorly at 3/10, primarily due to concerns about asset growth outpacing revenue growth and ongoing debt issuance, which could impact long-term stability. Momentum is weak at 2/10, indicating recent price trends have been negative, consistent with the stock’s decline over the past year. For more details, visit the HDB stock page.
What Are Insiders Doing with HDB Stock?
Insider activity over the past three months shows that insiders have sold approximately $135,920 worth of stock, with no recorded insider purchases during the same period. Over the past twelve months, insider selling totaled $271,660, again with no insider buying activity. This net selling trend may reflect personal portfolio management or cautious sentiment among executives but does not necessarily indicate a change in company fundamentals.
What This Means for Investors
HDFC Bank’s recent executive penalties have introduced a degree of uncertainty, but the internal review’s conclusion that the actions were business overreach rather than misconduct may mitigate longer-term reputational risks. From a valuation standpoint, the stock appears modestly undervalued with a 26.4% margin of safety based on GF Value™. The company’s strong growth profile and reasonable profitability contrast with weaker financial strength and momentum signals, suggesting a mixed but generally constructive outlook. Investors should weigh these factors carefully in the context of their risk tolerance and investment horizon.
For the complete analysis, visit the HDB stock page. You can also use the GuruFocus Stock Screener to find similar opportunities.
Frequently Asked Questions
What is HDB's GF Score™?
HDFC Bank’s GF Score™ is 73 out of 100, indicating a strong overall quality with particular strengths in growth and valuation, though financial strength and momentum are weaker.
Is HDB overvalued or undervalued?
Based on GF Value™, HDB is modestly undervalued by 26.4%, trading at $23.19 compared to an intrinsic value estimate of $31.51.
What is HDB's P/E ratio compared to historical?
HDFC Bank’s current trailing P/E ratio is 14.69x, which is below its 5-year median P/E of 19.96x, suggesting the stock is trading at a discount relative to its historical earnings valuation.
This stock alert was generated using automated technology and GuruFocus financial data to provide readers with timely and accurate market reporting. This content was reviewed by GuruFocus editorial team prior to publication. Please send any questions or comments about this story to [email protected].

