


On July 28, 2026, Unity Software Inc U shares rose 4.6% to a current price of $31.83, showing a notable recovery in the context of a 52-week trading range of $16.78 to $52.15. The stock has experienced a year-to-date decline of 27.9% and is down 5.0% over the past year.
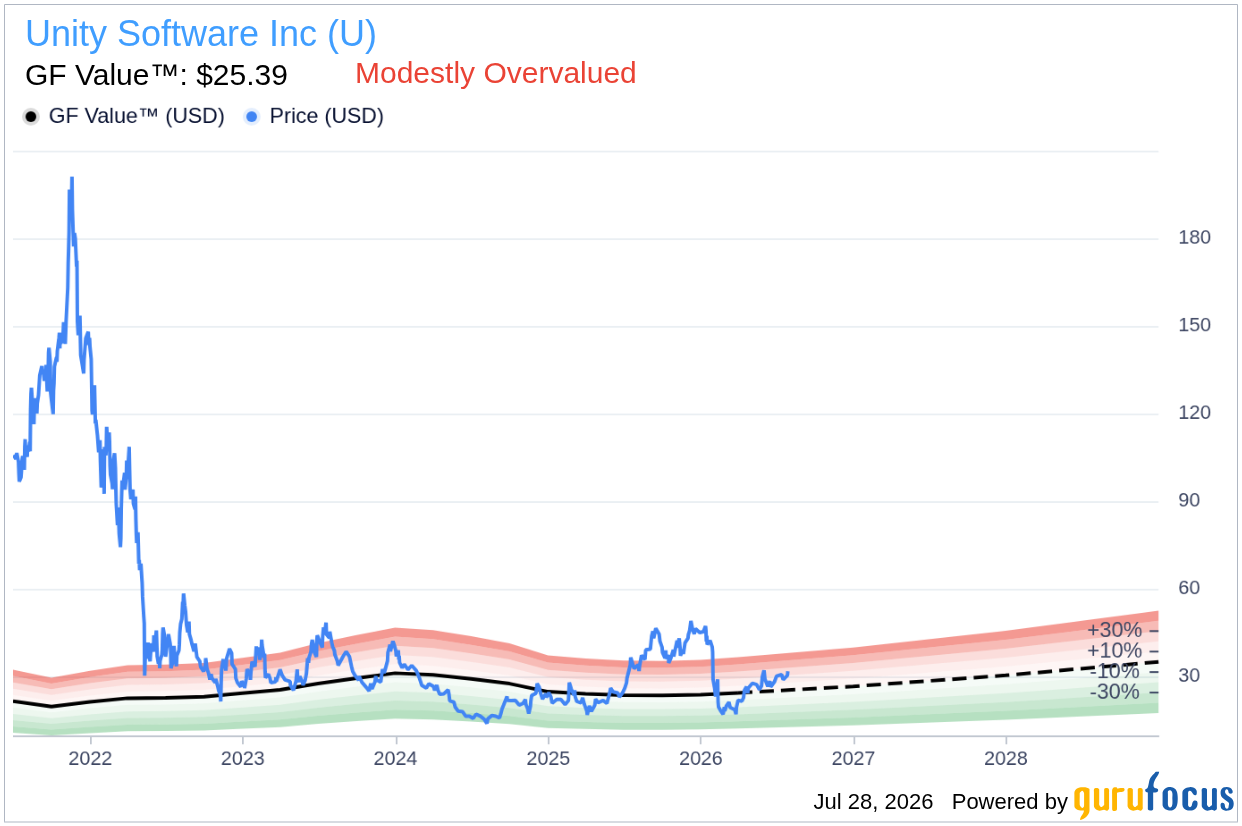
- GF Value™ verdict: Current price is $31.83 vs GF Value of $25.39, indicating a 25.4% overvaluation.
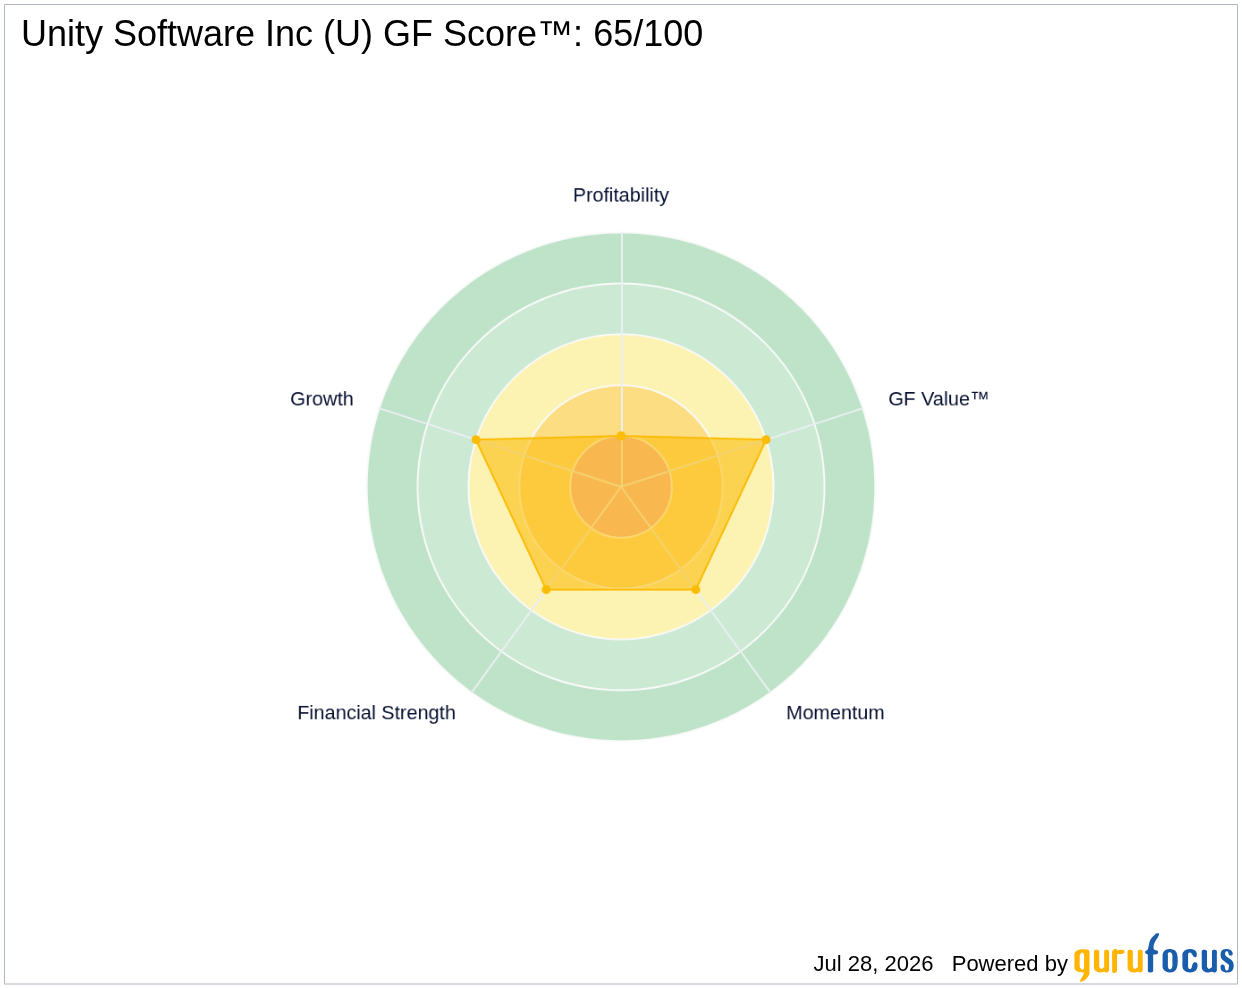
- GF Score™: 65/100, which suggests an above-average overall performance relative to peers.
- Most notable signal: Insiders sold $5.4M worth of shares in the last three months, indicating a lack of confidence from company insiders.
Is U Overvalued or Undervalued?
Unity Software Inc U is currently trading at $31.83, significantly above its GF Value™ estimate of $25.39. This represents a 25.4% overvaluation, indicating that the stock price may not fully reflect the company's intrinsic value. The GF Value™ is GuruFocus' proprietary estimate that considers historical trading multiples, business growth, and future performance forecasts. In this case, the GF Valuation label categorizes U as "Modestly Overvalued," which serves as a directional warning for investors.
The current overvaluation suggests a margin of safety is absent, making it a riskier investment at this price point. For a loss-making company like Unity, earnings-based valuations (such as P/E ratios) are not applicable, and a Price-to-Sales (P/S) analysis may offer more insight. Historically, Unity has traded at a median P/S ratio of approximately 7.5x. Given its current price, U's valuation may not align with its historical performance, raising concerns about future growth and profitability.
How Does U's Valuation Compare to Its History?
As Unity Software does not generate profits, traditional P/E ratios are not relevant for valuation comparisons. Below is a table summarizing the relevant metrics:
| Metric | Current | Historical |
|---|---|---|
| P/S Ratio | Not Available | ~7.5x (historical median) |
Unfortunately, without available P/E data, we cannot directly compare current valuations to historical averages. However, this aligns with the GF Value™ conclusion that Unity is presently overvalued, which poses a significant risk to potential investors looking at the company's future earnings and growth trajectory.
What Does U's GF Score™ Tell Us?
The GF Score™ assesses a company's overall financial health and performance relative to its peers. With a score of 65/100, Unity is positioned above average. The strongest sub-rank is its Growth Rank of 6/10, indicating reasonable growth prospects, while its Profitability Rank is notably low at 2/10, reflecting ongoing challenges in generating profits.
| Metric | Rating |
|---|---|
| GF Score™ | 65/100 |
| Financial Strength | 5/10 |
| Profitability | 2/10 |
| Growth | 6/10 |
| Valuation | 6/10 |
| Momentum | 5/10 |
The scores collectively suggest that while Unity possesses growth potential, its profitability remains a significant concern, indicating that the company is struggling to turn revenue into profit effectively. This could have implications for future valuations and investment sentiment.
What Are Gurus and Insiders Doing with U?
Currently, six gurus hold positions in Unity Software Inc, with four of them adding to their stakes and four trimming their positions in recent quarters. This mixed activity suggests a divided opinion among seasoned investors regarding the stock's future potential. Such guru ownership insights are a unique aspect of the data provided by GuruFocus, distinguishing it from other financial platforms.
On the insider front, the sale of $5.4M worth of shares by insiders over the last three months raises red flags regarding their confidence in the company's prospects. The absence of any insider buying during this period may imply a bearish outlook among those who understand the company's operations best, which could further signal caution for prospective investors.
What This Means for Investors
Given the analysis presented, Unity Software Inc is currently deemed overvalued based on the GF Value™ estimate. The combination of its high P/S ratio compared to historical norms and the concerning signs of insider selling highlights potential risks associated with investing in the stock at this juncture. Investors might want to carefully consider these factors when evaluating Unity’s prospects.
For further insights, you can visit the Unity Software Inc U stock page, along with additional resources on the GF Value™ page.
Frequently Asked Questions
What is U's GF Score™?
The GF Score™ for Unity Software Inc is 65/100, indicating an above-average performance relative to its peers, although it has notable weaknesses in profitability.
Is U overvalued or undervalued?
Unity Software Inc is considered overvalued, with a GF Value™ estimate of $25.39 compared to its current price of $31.83, suggesting a 25.4% overvaluation.
What is U's P/E ratio?
Unity Software does not have a relevant P/E ratio due to its current unprofitability; therefore, traditional earnings-based measures are not applicable for this analysis.
This stock alert was generated using automated technology and GuruFocus financial data to provide readers with timely and accurate market reporting. This content was reviewed by GuruFocus editorial team prior to publication. Please send any questions or comments about this story to [email protected].

