

On August 03, 2026, T1 Energy Inc (NYSE: TE) experienced a pre-market stock price increase of 6.4% following the announcement of a contract to deliver 641 MW of solar modules to Clearway Energy (CWEN). This deal highlights T1 Energy’s strategic push to expand its domestic solar supply chain amid trade policy uncertainties.
- T1 Energy’s current Price-to-Sales (P/S) ratio stands at 0.95, near its two-year low and well below its historical median of approximately 1.85, signaling market skepticism about near-term growth prospects. Earnings-based valuation metrics like P/E are not applicable due to ongoing unprofitability.
- GF Score™ of 22/100 reflects significant challenges in profitability and financial strength despite some operational momentum.
- Insider activity shows no insider buying but substantial insider selling totaling $190.3 million over the past three months, indicating cautious sentiment from company insiders.
What's Behind the News?
The recent contract to supply 641 MW of solar modules to Clearway Energy marks a significant commercial win for T1 Energy. These modules will incorporate domestically produced solar cells from T1’s G2_Austin facility and be manufactured at the G1_Dallas plant. This deal aligns with T1 Energy’s broader strategy to increase the domestic content of its solar products, a move designed to mitigate risks associated with international trade tensions and tariffs affecting solar imports.
T1 Energy Inc operates in the Industrials sector under the Industrial Products industry. The company is focused on building an integrated U.S. solar supply chain, manufacturing photovoltaic (PV) solar modules using advanced technologies such as Passivated Emitter and Rear Contact (PERC) and Tunnel Oxide Passivated Contact (TOPCon). With a market capitalization of $1.16 billion, T1 Energy is positioning itself as a key player in the domestic solar manufacturing landscape, targeting utility-scale developers, commercial and industrial customers, and residential end users.
Is TE Overvalued on a Price-to-Sales Basis?
T1 Energy’s current Price-to-Sales ratio of 0.95 is notably below its historical median of approximately 1.85 over the past two years. This valuation level suggests that the market is pricing in modest near-term revenue growth or is discounting risks related to the company’s ongoing unprofitability and cash flow challenges. For context, the P/S ratio is a preferred metric here because T1 Energy is not profitable, with a trailing twelve-month EPS of -2.03 and negative operating margins. As such, traditional earnings-based valuation metrics like the P/E ratio are not meaningful for TE at this stage.
While the GF Value™ metric cannot provide a precise fair value estimate for T1 Energy due to its speculative growth profile and negative earnings, it serves as a directional caution. Investors should interpret GF Value™ as a supplementary signal rather than a definitive valuation anchor in this context. For more on GF Value™, see GF Value™ on GuruFocus.
What Does TE's GF Score™ Tell Us?
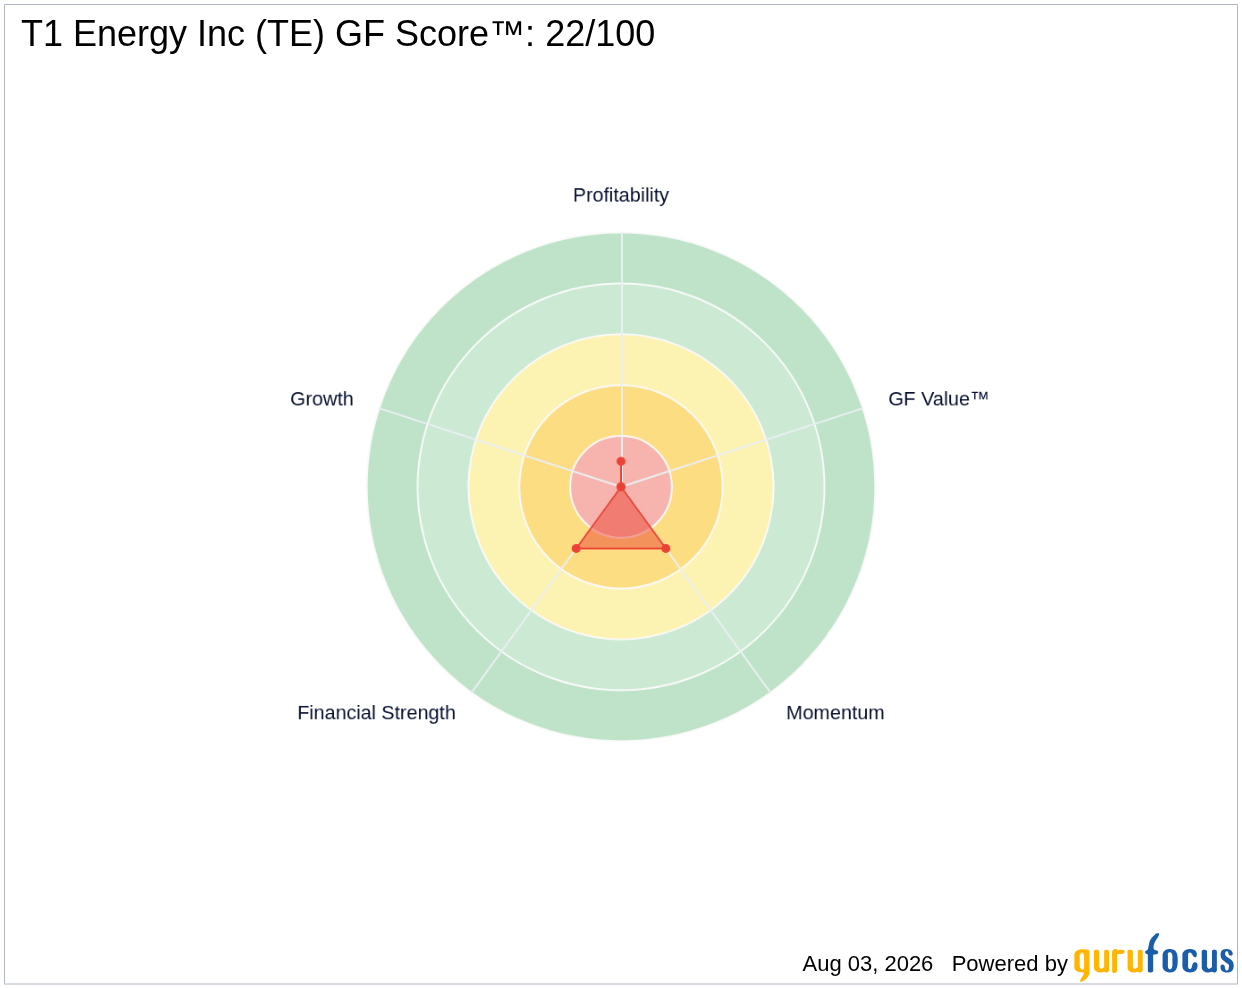
The GF Score™ aggregates multiple fundamental factors including financial strength, profitability, growth, valuation, and momentum to provide a comprehensive snapshot of a company’s overall health and investment quality. T1 Energy’s GF Score™ of 22 out of 100 indicates considerable weaknesses, particularly in profitability and financial stability, despite some positive momentum signals.
| Metric | Rating |
|---|---|
| GF Score™ | 22/100 |
| Financial Strength | 3/10 (Poor) |
| Profitability | 1/10 (Very Weak) |
| Momentum | 3/10 (Below Average) |
T1 Energy’s weakest areas are profitability and financial strength, underscored by negative margins and a concerning Altman Z-Score of -0.45, which places the company in the distress zone. On the positive side, the company shows some momentum, likely driven by recent contract wins and operational progress such as the upcoming solar cell production at its G2_Austin facility. For a detailed breakdown, visit the TE stock page.
What Are Gurus and Insiders Doing with TE?
GuruFocus tracks that five premium gurus currently hold T1 Energy shares. Among these, two have increased their positions while three have trimmed holdings in recent quarters, reflecting a mixed but engaged institutional interest. This guru activity is a valuable signal, as it provides insight into sophisticated investors’ views that are not available on platforms like Simply Wall St or Morningstar.
In contrast, insider activity over the past three months has been dominated by selling, with no insider purchases reported. Insiders sold approximately $190.3 million worth of shares, which may signal internal caution about the company’s near-term prospects or liquidity needs.
What This Means for Investors
T1 Energy’s recent contract win and operational milestones are positive developments, but the company remains unprofitable and financially fragile as reflected in its low GF Score™ and insider selling activity. The stock’s P/S ratio near a two-year low suggests the market is pricing in significant risks and limited growth visibility. Investors should weigh the potential of T1 Energy’s domestic solar supply chain ambitions against its current financial challenges and mixed signals from institutional and insider ownership. For those interested in monitoring T1 Energy’s evolving fundamentals and market sentiment, visit the TE stock page or explore other opportunities with the GuruFocus Stock Screener.
Frequently Asked Questions
What is TE's GF Score™?
T1 Energy’s GF Score™ is 22 out of 100, indicating significant weaknesses in profitability and financial strength despite some momentum. The score reflects an overall challenging fundamental profile.
Is TE overvalued or undervalued?
Based on its Price-to-Sales ratio of 0.95, which is near a two-year low and below its historical median, TE appears to be valued conservatively by the market. Earnings-based valuation metrics like P/E are not meaningful due to ongoing losses.
What is TE's P/E ratio compared to historical?
T1 Energy currently has no meaningful P/E ratio because it is unprofitable. Instead, financial strength metrics and cash flow indicators provide better insight into its financial health.
This stock alert was generated using automated technology and GuruFocus financial data to provide readers with timely and accurate market reporting. This content was reviewed by GuruFocus editorial team prior to publication. Please send any questions or comments about this story to [email protected].

