


On August 03, 2026, Vulcan Materials Co VMC shares rose 5.6% to $283.59, reflecting a recovery amid a challenging 52-week range of $252.35 to $331.09. This price movement comes as VMC continues to navigate market fluctuations.
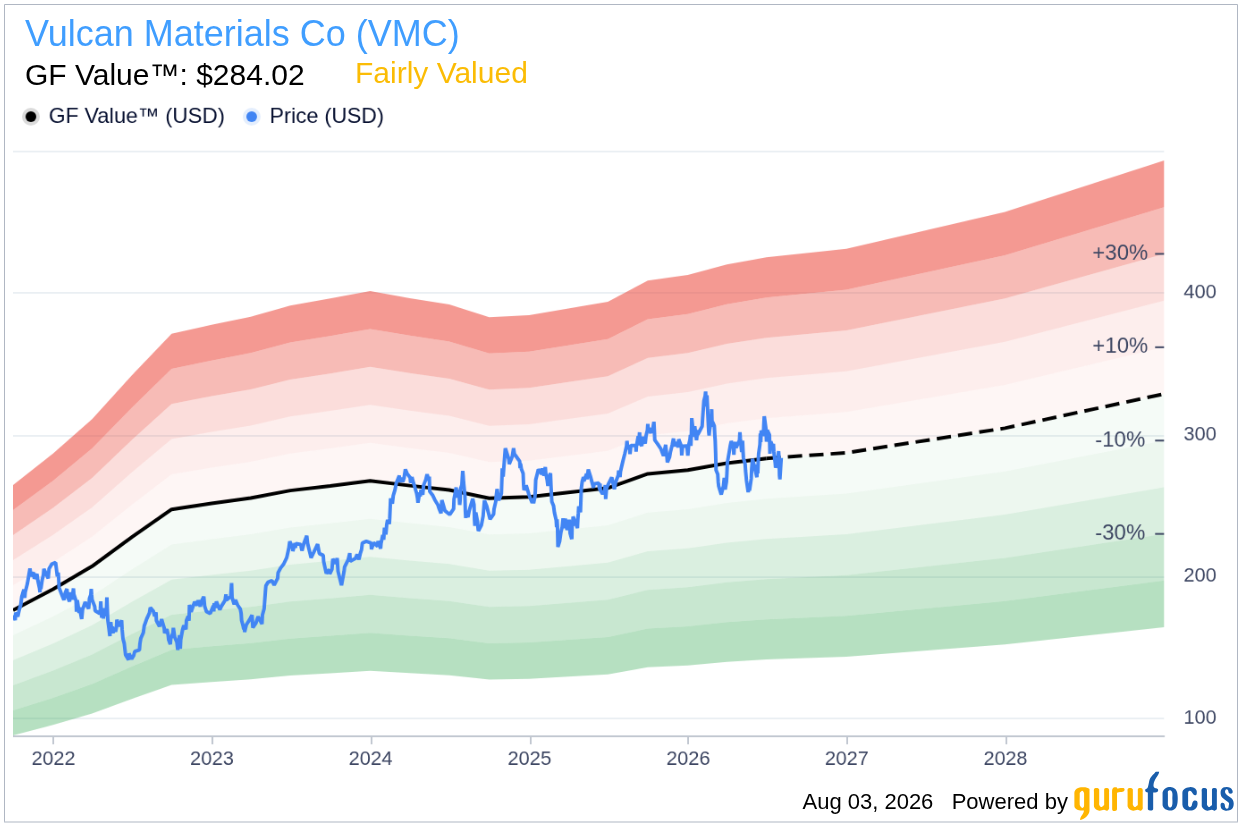
- GF Value™ verdict: Current price of $283.59 is 0.2% undervalued compared to GF Value™ of $284.02.
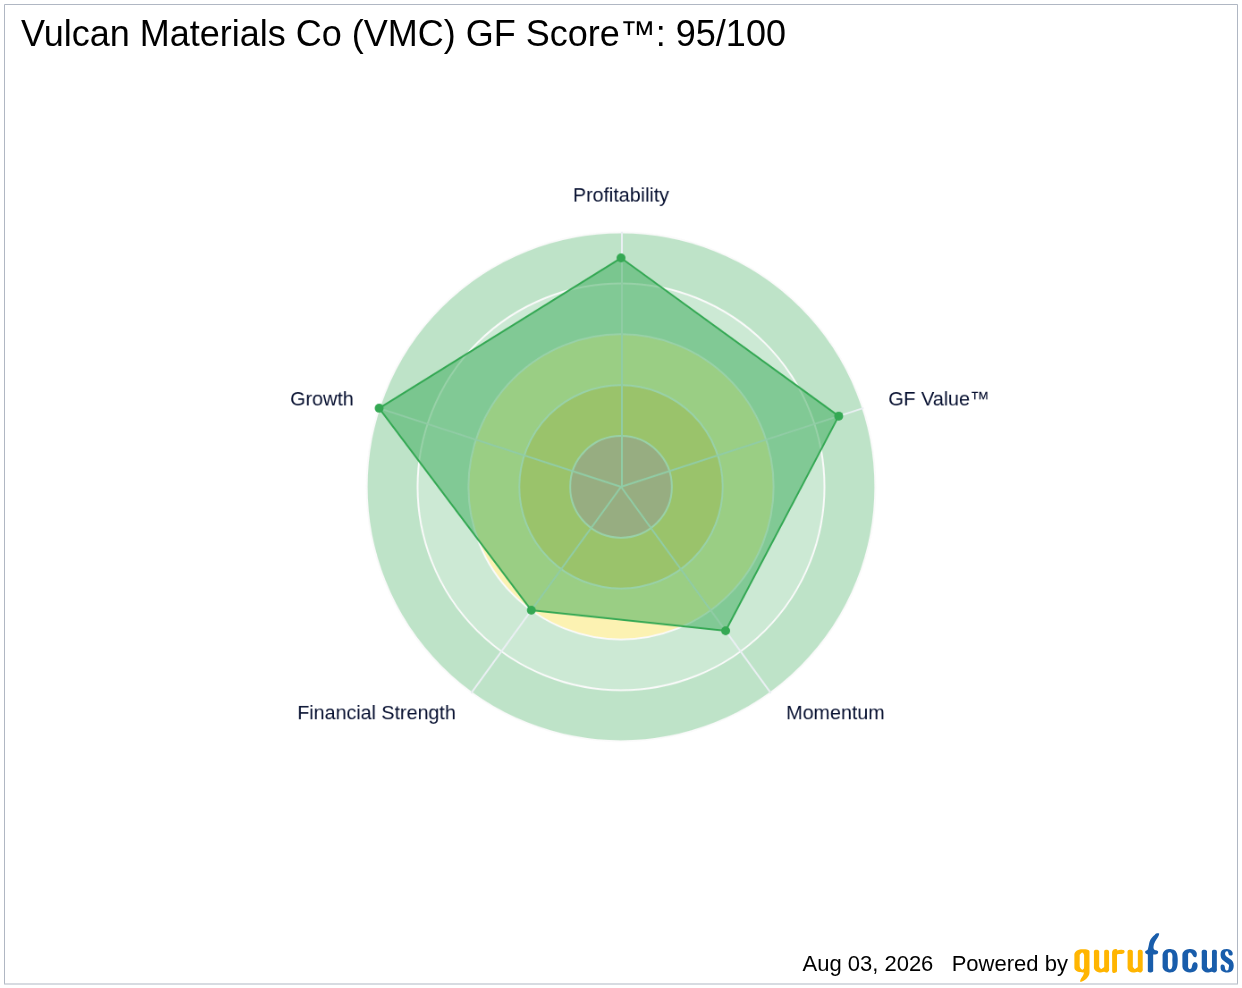
- GF Score™ of 95/100 indicates a strong overall performance, suggesting robust fundamentals and growth potential.
- Notable signal: Insider activity shows a net sale of $0.6M in the last three months, with no recorded purchases.
Is VMC Overvalued or Undervalued?
With the current price of $283.59 positioned slightly below the GF Value™ of $284.02, Vulcan Materials Co is deemed to be 0.2% undervalued. This minimal margin of safety suggests that while there is a slight opportunity for investment based on intrinsic value, the upside is limited. The GF Valuation label categorizes VMC as fairly valued, indicating that while there are attractive aspects, caution is warranted due to the narrow valuation gap.
The GF Value™ is GuruFocus's proprietary estimate of a stock's intrinsic value, calculated through a combination of historical trading multiples, past business growth, and future performance projections. In VMC's case, the valuation reflects a balanced assessment of current market conditions against its historical performance.
How Does VMC's Valuation Compare to Its History?
| Metric | Current | Historical |
|---|---|---|
| P/E (TTM) | 33.5x | 37.3x |
| Forward P/E | 31.0x | N/A |
Currently, VMC's P/E (TTM) stands at 33.5x, which is approximately 10% below its 5-year median of 37.3x. This analysis aligns with the GF Value™ verdict, reinforcing the notion that VMC's shares are fairly valued in relation to historical standards. Such a lower P/E ratio may suggest that the stock is trading more attractively compared to its past, but investors should still be mindful of market dynamics.
What Does VMC's GF Score™ Tell Us?
The GF Score™ serves as a comprehensive measure of a company's financial strength, profitability, growth potential, valuation, and momentum. VMC's score of 95/100 highlights its strong position, particularly in terms of growth and valuation.
| Metric | Rating |
|---|---|
| GF Score™ | 95/100 |
| Financial Strength | 6/10 |
| Profitability | 9/10 |
| Growth | 10/10 |
| Valuation | 9/10 |
| Momentum | 7/10 |
The scores indicate that VMC excels in growth (10/10) and profitability (9/10), suggesting a solid capacity for generating returns and expanding its operations. However, it presents a moderate financial strength rating of 6/10, which indicates some caution regarding its balance sheet and liquidity. Overall, VMC’s robust growth and valuation scores may attract investors looking for solid long-term performance.
What Are Gurus and Insiders Doing with VMC?
Currently, 13 gurus hold VMC, with a balanced split of 7 adding to their positions and 7 trimming their stakes in recent quarters. This indicates a mixed sentiment among institutional investors, reflecting both confidence and caution in the stock's prospects.
On the insider front, the sale of $0.6M in shares within the last three months without any recorded purchases suggests a degree of caution from company executives. Such insider activity may indicate that insiders are taking profits, or it may reflect personal financial strategies rather than a lack of confidence in VMC's future.
What This Means for Investors
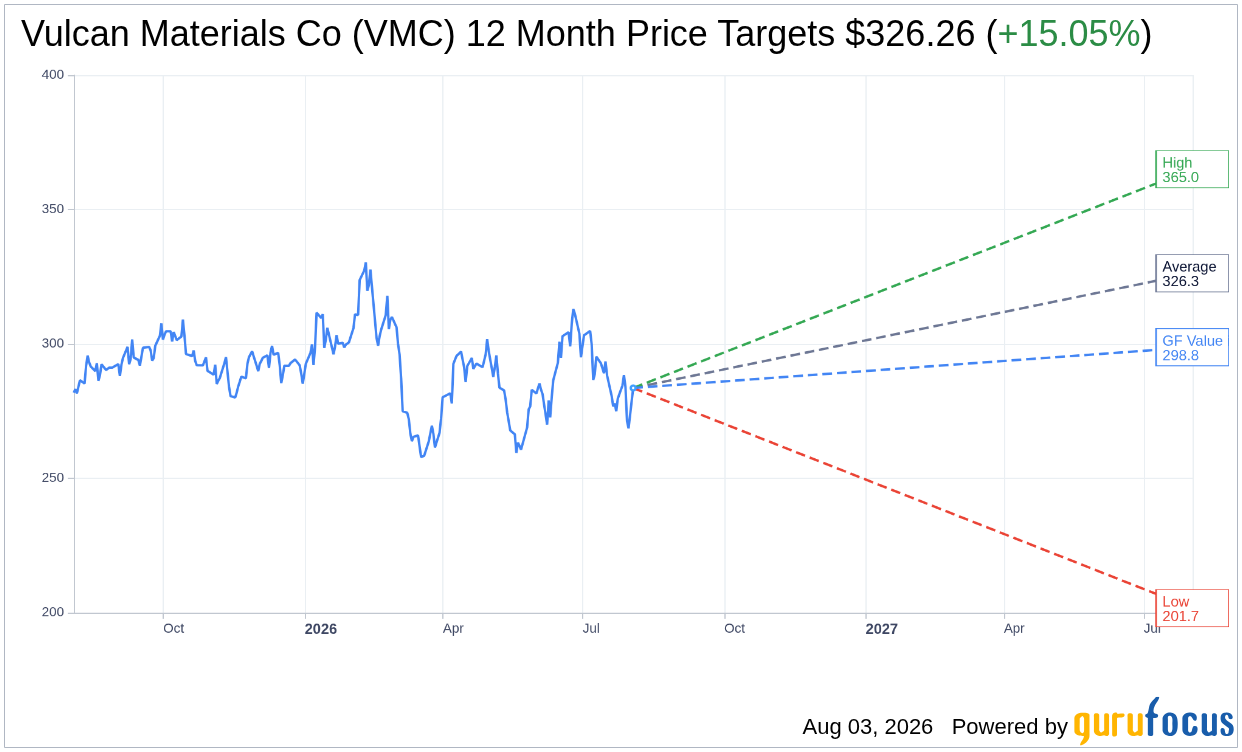
Given the slight undervaluation identified by the GF Value™ of $284.02 against the current price of $283.59, VMC is positioned as fairly valued with minimal opportunity for significant upside. Investors may find the company's strong fundamentals and growth potential appealing, but should also weigh the cautionary signals from insider activity and the mixed sentiment from gurus. For further details, visit the Vulcan Materials Co VMC stock page, and explore the GF Value™ page for in-depth valuation insights.
Frequently Asked Questions
What is VMC's GF Score™?
VMC's GF Score™ is 95/100, indicating a strong overall performance based on various financial metrics.
Is VMC overvalued or undervalued?
VMC is 0.2% undervalued according to the GF Value™, suggesting limited upside potential at its current price.
What is VMC's P/E ratio?
VMC's P/E ratio is 33.5x, which is 10% below its 5-year median of 37.3x, indicating a more attractive valuation compared to historical levels.
This stock alert was generated using automated technology and GuruFocus financial data to provide readers with timely and accurate market reporting. This content was reviewed by GuruFocus editorial team prior to publication. Please send any questions or comments about this story to [email protected].

