

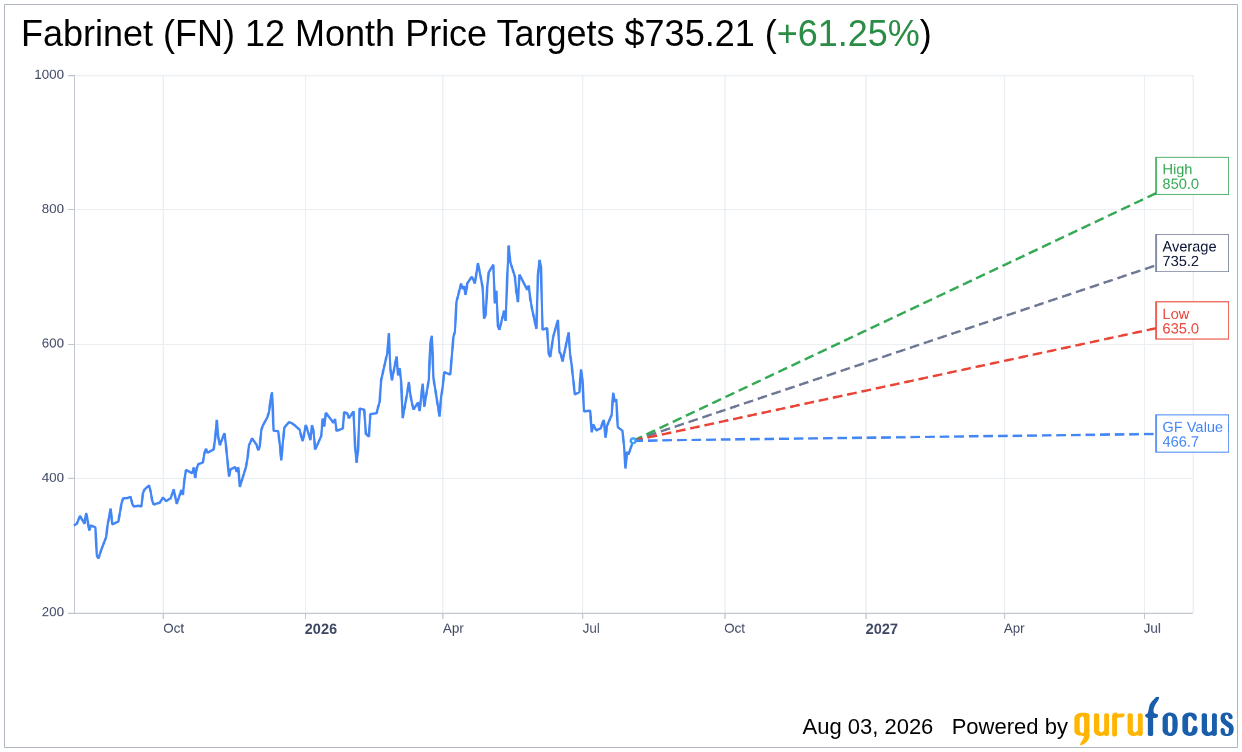
On August 03, 2026, Fabrinet FN shares rose 4.7%, bringing the current price to $455.94. The stock has experienced a 52-week range of $272.49 to $748.89, showcasing significant volatility throughout the year.
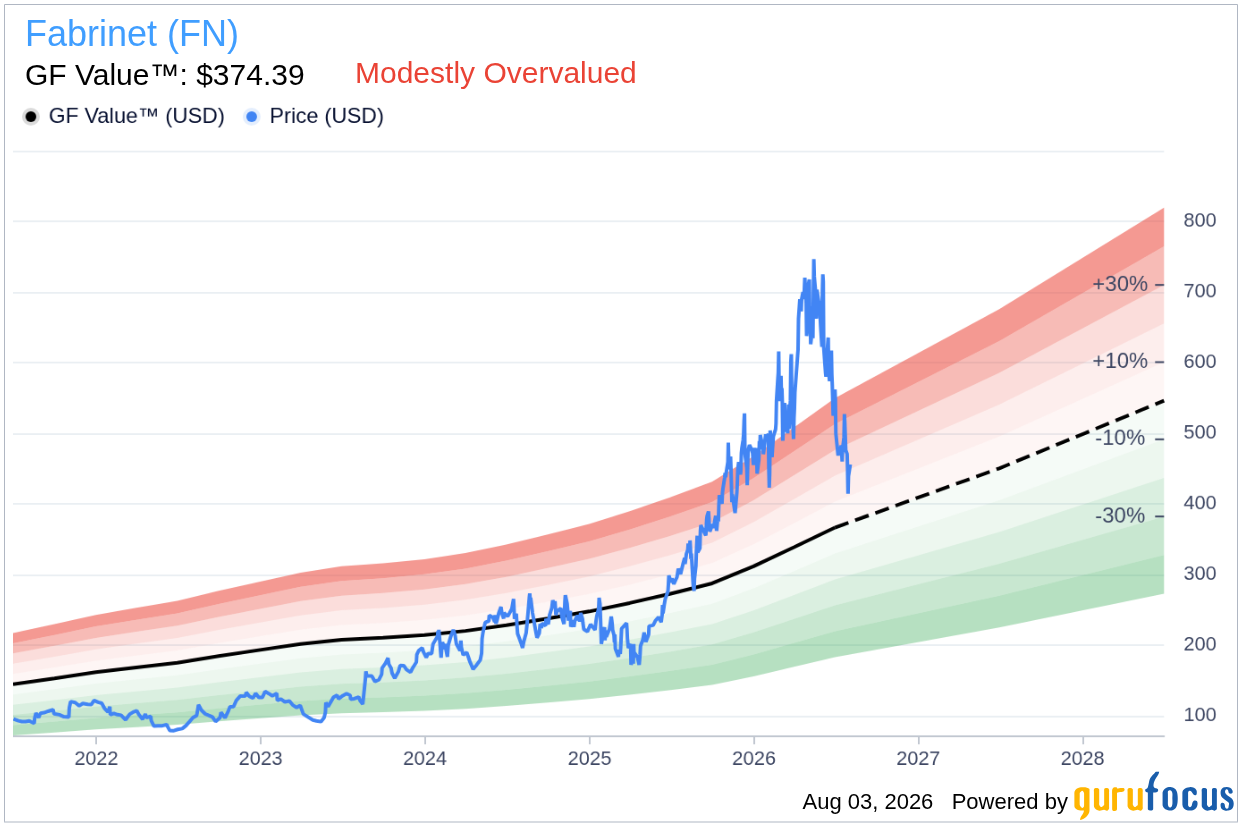
- GF Value™ verdict: Currently priced at $455.94, which is 21.8% above the GF Value™ estimate of $374.39, indicating it is overvalued.
- GF Score™: 98/100, suggesting a strong overall performance across various metrics.
- Notable signal: Insiders have sold $1.8M worth of stock in the last three months, with no buying activity observed.
Is FN Overvalued or Undervalued?
The current valuation of Fabrinet FN suggests that the stock is overvalued. With a GF Value™ of $374.39, the stock's current price of $455.94 represents a 21.8% premium over its intrinsic value. This scenario presents a lack of margin of safety for potential investors, as the stock is trading significantly above what GuruFocus estimates to be its fair value. The GF Valuation label indicates that the stock is moderately overvalued, which means that risks may be associated with entering a position at this price point.
GuruFocus' GF Value™ is a proprietary estimate that derives its estimate from a blend of historical trading multiples, past business growth, and projections for future performance. When a stock trades above its GF Value™, as Fabrinet currently does, the implication is that investors may be paying more than the stock is fundamentally worth, raising concerns about the sustainability of the current price level in the face of market corrections.
How Does FN's Valuation Compare to Its History?
| Metric | Current | Historical |
|---|---|---|
| P/E (TTM) | 39.2x | 25.7x |
| Forward P/E | 26.6x | N/A |
Fabrinet's current P/E ratio of 39.2x is significantly higher than its 5-year median P/E of 25.7x, placing it 53% above its historical valuation levels. The forward P/E of 26.6x suggests expected earnings growth but still indicates a valuation that is high compared to historical averages. This P/E analysis aligns with the GF Value™ verdict, reinforcing the notion that FN is currently overvalued.
What Does FN's GF Score™ Tell Us?
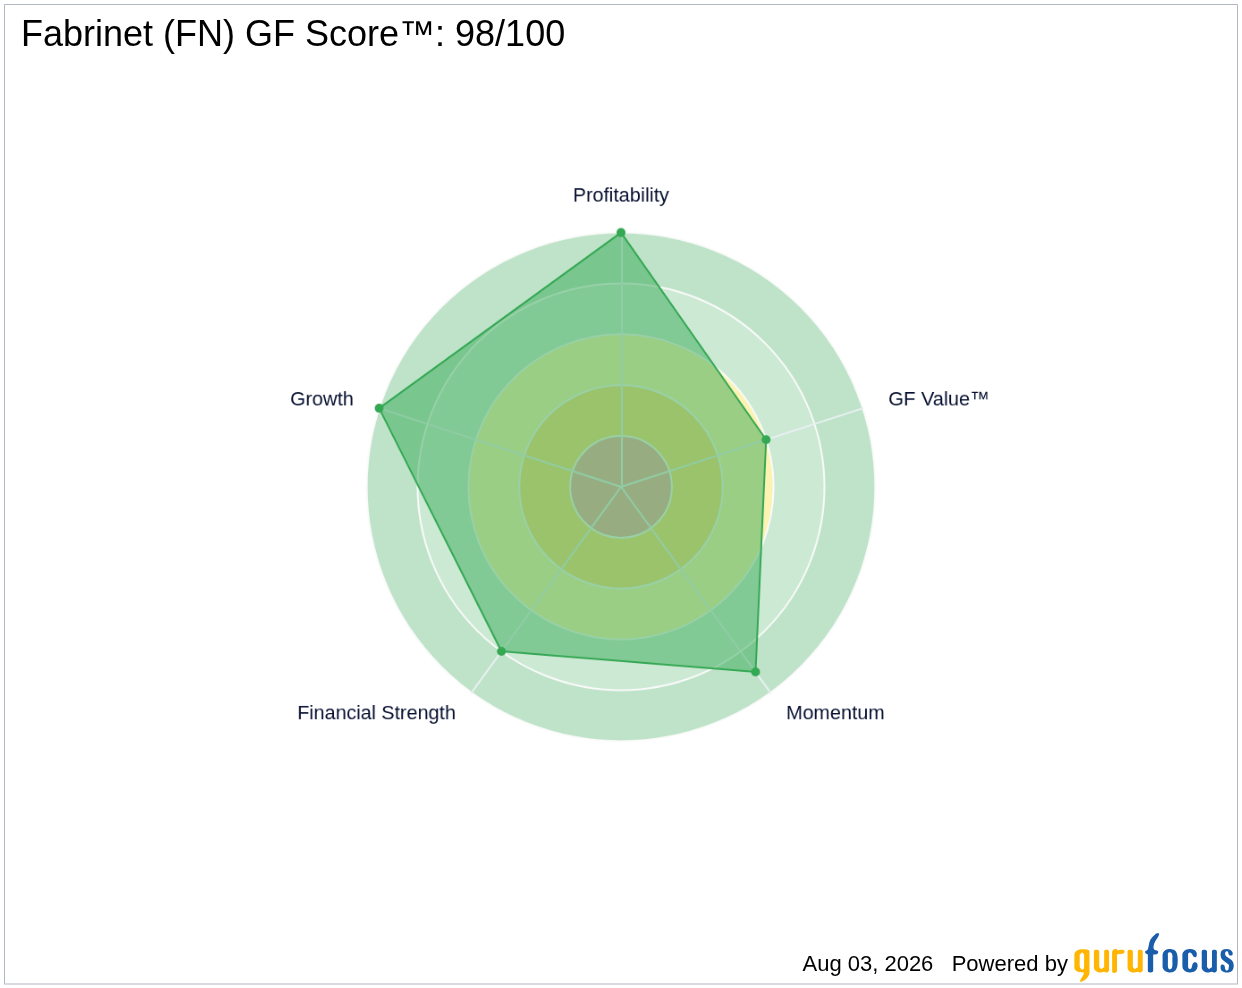
The GF Score™ is an aggregate measure that assesses a stock's performance based on several fundamental factors, including financial strength, profitability, growth, valuation, and momentum. Fabrinet's score of 98/100 indicates a robust performance overall, with particular strengths in profitability and growth metrics.
| Metric | Rating |
|---|---|
| GF Score™ | 98 |
| Financial Strength | 8/10 |
| Profitability | 10/10 |
| Growth | 10/10 |
| Valuation | 6/10 |
| Momentum | 9/10 |
The strongest areas for Fabrinet are its profitability and growth, both receiving perfect scores of 10/10, indicating exceptional returns and expansion potential. However, the valuation rank at 6/10 indicates some concerns regarding its current price level relative to its growth prospects. Overall, while Fabrinet's operational metrics are strong, the elevated valuation raises questions about entering or holding the stock at this time.
What Are Gurus and Insiders Doing with FN?
Currently, 6 gurus are holding Fabrinet stock, with 2 increasing their positions and 5 trimming their holdings in recent quarters. This mixed activity suggests a cautious sentiment among institutional investors, reflecting the recent volatility and current valuation concerns.
Additionally, insider activity shows that insiders have sold $1.8 million worth of shares in the last three months without any buying activity. This selling could indicate a lack of confidence in the stock's future performance at current price levels, which is a critical signal for potential investors to consider.
What This Means for Investors
In conclusion, Fabrinet FN is currently overvalued according to GF Value™, which estimates its intrinsic value at $374.39 compared to the current market price of $455.94. The lack of a margin of safety coupled with recent insider selling and mixed guru activity suggests that caution may be warranted for those considering an investment in the stock. For more detailed insights, you can visit the Fabrinet (FN) stock page.
Frequently Asked Questions
What is FN's GF Score™?
Fabrinet's GF Score™ is 98/100, indicating a strong overall performance across various financial metrics.
Is FN overvalued or undervalued?
Fabrinet is overvalued, with a current price that exceeds its GF Value™ by 21.8%.
What is FN's P/E ratio?
The P/E ratio for Fabrinet (TTM) is 39.2x, which is significantly above its 5-year median P/E of 25.7x.
This stock alert was generated using automated technology and GuruFocus financial data to provide readers with timely and accurate market reporting. This content was reviewed by GuruFocus editorial team prior to publication. Please send any questions or comments about this story to [email protected].

