


On August 04, 2026, copper futures climbed to $14,000 per ton on the London Metal Exchange, hitting a two-month high amid rising volumes of copper arriving at U.S. ports. The surge in copper prices and tightening inventories have renewed investor focus on Freeport-McMoRan Inc (NYSE: FCX), a leading copper miner.
- GF Value™ verdict: FCX is trading at $66.96, approximately 40.4% above its intrinsic GF Value™ of $47.68, indicating significant overvaluation.
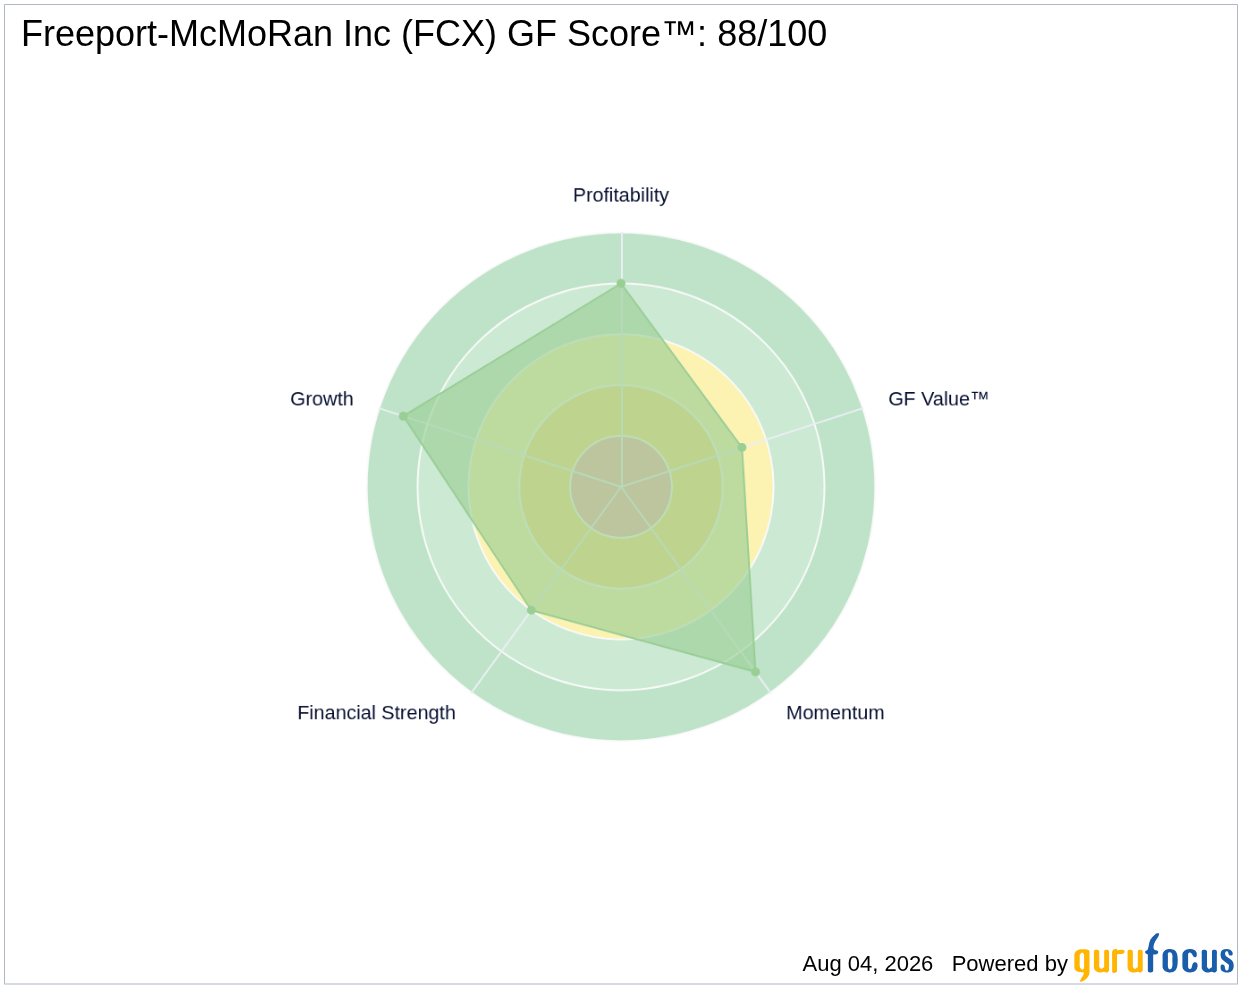
- GF Score™: 88/100, reflecting strong overall financial health and operational momentum.
- Key financial signal: Insider activity shows no insider buying and $0.5 million in insider selling over the past three months, suggesting cautious sentiment from company insiders.
What's Behind the News?
The recent spike in copper futures to $14,000 per ton marks a notable tightening in the copper market. This price rally is supported by record shipments of over 200,000 tons of copper arriving at U.S. ports in July—the highest monthly volume since 2014. Meanwhile, London Metal Exchange (LME) warehouse inventories have dropped to a five-month low, driven by shipments to China aimed at easing local shortages. The widening premium of $99.50 per ton on nearby contracts over three-month futures, the largest since January, underscores the market’s increasing tightness and demand urgency.
Freeport-McMoRan Inc, with a market capitalization of $96.26 billion, operates in the Basic Materials sector within the Metals & Mining industry. The company owns stakes in 10 copper mines worldwide, including major operations like the Grasberg mine in Indonesia (49% ownership), Cerro Verde in Peru (55%), and Morenci in Arizona (72%). In 2025, FCX sold approximately 1.1 million metric tons of copper, making it one of the largest copper producers globally. Its diversified portfolio also includes gold and molybdenum production, positioning FCX as a key beneficiary of rising copper prices.
Is FCX Overvalued or Undervalued?
According to GuruFocus’ proprietary GF Value™ metric, FCX is trading at $66.96 per share, which is 40.4% above its intrinsic value estimate of $47.68. This significant premium suggests a limited margin of safety for new investors, especially amid the cyclical nature of the metals and mining sector. The GF Value™ calculation incorporates historical trading multiples, past growth, and future performance expectations, providing a comprehensive valuation perspective.
Examining valuation multiples, FCX’s trailing twelve-month price-to-earnings (P/E) ratio stands at 32.99x, notably higher than its five-year median P/E of 28.47x. This elevated P/E ratio aligns with the GF Value™ verdict of overvaluation, reflecting investor optimism likely fueled by the recent copper price rally. However, the forward P/E ratio is currently not available, which limits visibility into market expectations for future earnings. Investors should weigh this premium against the company’s growth prospects and market dynamics. For more details, visit the GF Value™ page for FCX.
What Does FCX's GF Score™ Tell Us?
The GF Score™ is a composite measure that evaluates a company’s overall quality by analyzing financial strength, profitability, growth, valuation, and momentum. FCX’s GF Score™ of 88 out of 100 indicates robust fundamentals and operational performance. Below is a breakdown of the key sub-ranks that contribute to this score:
| Metric | Rating (out of 10) |
|---|---|
| GF Score™ | 88 |
| Financial Strength | 6 |
| Profitability | 8 |
| Growth | 9 |
| Valuation | 5 |
| Momentum | 9 |
FCX’s strongest areas are growth and momentum, each scoring 9 out of 10, reflecting solid earnings growth in the past year (+55.1%) and positive stock price performance (up 32.78% year-to-date). Profitability is also strong at 8/10, supported by expanding operating margins (23.93%) and a healthy EBITDA margin (35.67%). Financial strength is moderate at 6/10, with a solid Altman Z-Score of 3.03 indicating low bankruptcy risk but a debt-to-equity ratio of 0.52 suggesting some leverage. Valuation ranks lowest at 5/10, consistent with the GF Value™ assessment of overvaluation. For further insights, see the FCX stock page.
What Are Gurus and Insiders Doing with FCX?
GuruFocus tracks 16 premium gurus holding FCX, with 6 adding shares and 12 trimming positions in recent quarters. This mixed guru activity suggests a cautious stance among top institutional investors amid the stock’s elevated valuation. Insider activity over the past three months shows no insider buying and $0.5 million in insider selling, indicating insiders are not accumulating shares at current levels. This combination of modest insider selling and net trimming by gurus highlights a prudent approach to FCX’s current price environment, a nuance often missed by platforms lacking guru 13F data.
What This Means for Investors
While FCX benefits from a strong copper market backdrop and exhibits solid operational and growth metrics, the stock’s current valuation presents a significant premium over its intrinsic GF Value™. The 40.4% overvaluation, coupled with a P/E ratio above its historical median, suggests limited margin of safety. Additionally, mixed signals from guru ownership and insider selling caution investors to carefully weigh the risks of entering at these elevated levels. Investors seeking exposure to copper via FCX should monitor valuation trends and market fundamentals closely. For a deeper dive into FCX’s fundamentals and valuation, visit the FCX stock page or explore opportunities through the GuruFocus Stock Screener.
Frequently Asked Questions
What is FCX's GF Score™?
FCX’s GF Score™ is 88 out of 100, indicating strong overall financial health, profitability, growth, and momentum, with moderate financial strength and valuation metrics.
Is FCX overvalued or undervalued?
Based on GF Value™, FCX is approximately 40.4% overvalued, trading at $66.96 versus an intrinsic value estimate of $47.68, signaling a significant premium in the current market price.
What is FCX's P/E ratio compared to historical?
FCX’s trailing twelve-month P/E ratio is 32.99x, which is higher than its five-year median P/E of 28.47x, reflecting elevated valuation levels relative to historical norms.
This stock alert was generated using automated technology and GuruFocus financial data to provide readers with timely and accurate market reporting. This content was reviewed by GuruFocus editorial team prior to publication. Please send any questions or comments about this story to [email protected].

