


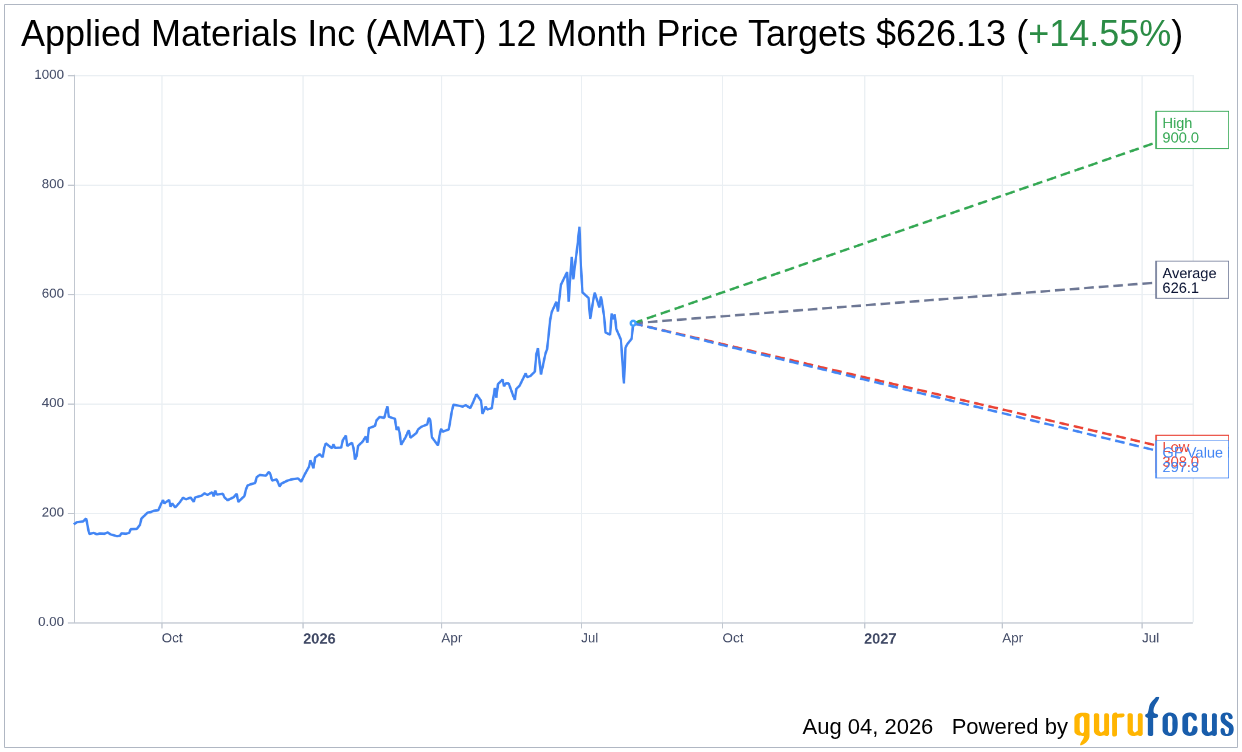
On August 04, 2026, Applied Materials Inc AMAT shares rose 5.5% to a current price of $546.62. The stock has experienced notable volatility over the past year, with a 52-week high of $739.67 and a low of $154.47.
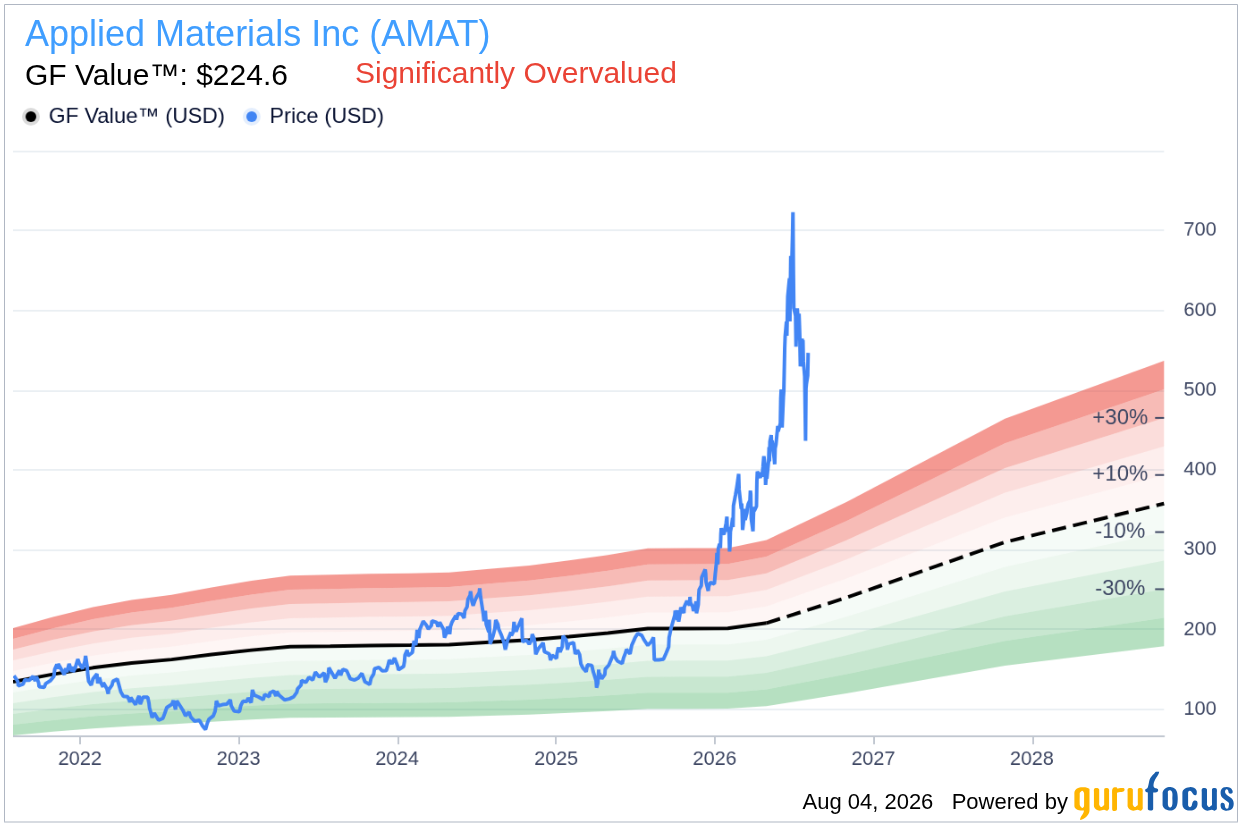
- GF Value™ verdict: Current price is $546.62 compared to a GF Value™ of $224.60, indicating the stock is 143.4% overvalued.
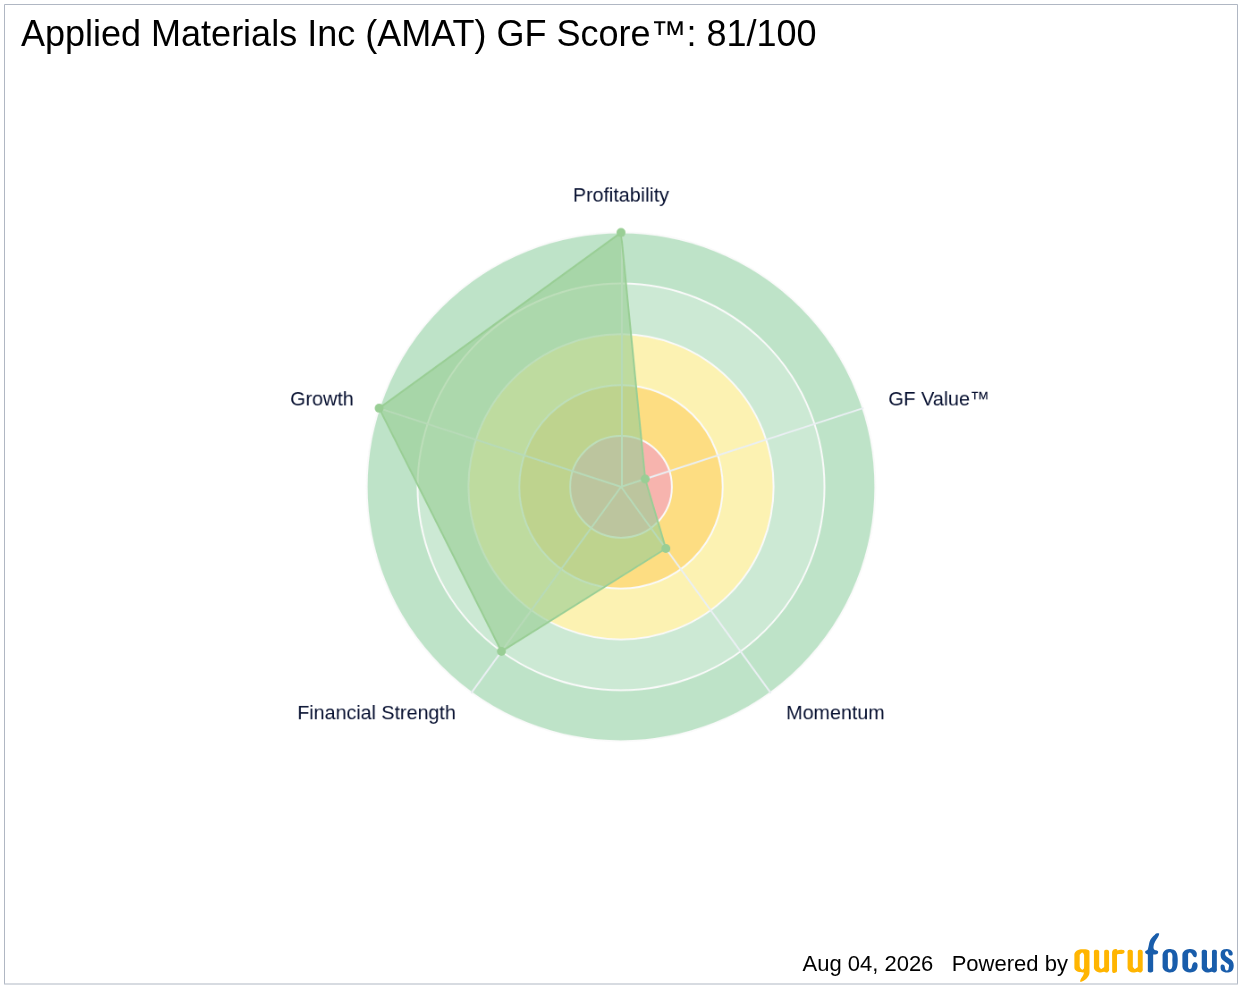
- GF Score™ of 81/100 suggests a strong overall performance relative to its peers.
- Insider activity shows significant selling, with insiders offloading $169.7M worth of shares in the last three months without any buying activity.
Is AMAT Overvalued or Undervalued?
Applied Materials Inc AMAT appears significantly overvalued based on the GF Value™, which estimates the fair value of the stock at $224.60. This indicates a substantial margin of safety for potential investors, as the current trading price exceeds the fair value estimate by 143.4%. The GF Valuation label classifies AMAT as significantly overvalued, highlighting the risks associated with buying at this level.
This overvaluation poses a risk to investors, as the discrepancy between the market price and the intrinsic value suggests a potential for price corrections in the future. While AMAT has demonstrated robust growth and strong financials, the current price may not be justified based on historical valuations and future performance estimates.
How Does AMAT's Valuation Compare to Its History?
| Metric | Current | Historical |
|---|---|---|
| P/E (TTM) | 51.3x | 20.4x |
| Forward P/E | 32.5x |
Currently, AMAT's P/E (TTM) stands at 51.3x, which is 152% above its 5-year median of 20.4x. This analysis confirms the GF Value™ verdict of overvaluation, further emphasizing that the stock is trading well above its historical valuation metrics.
What Does AMAT's GF Score™ Tell Us?
The GF Score™ is a composite measure that evaluates a company's performance across several metrics, indicating its overall financial health and potential for growth. AMAT's score of 81/100 reflects a strong position within its industry, with standout performance in Profitability and Growth.
| Metric | Rating |
|---|---|
| GF Score™ | 81/100 |
| Financial Strength | 8/10 |
| Profitability | 10/10 |
| Growth | 10/10 |
| Valuation | 1/10 |
| Momentum | 3/10 |
AMAT's strongest areas are its Profitability and Growth, both rated 10/10, indicating exceptional performance in generating returns and expanding its business. However, the Valuation rank of 1/10 signals significant concerns regarding its current price relative to its intrinsic value.
What Are Gurus and Insiders Doing with AMAT?
Currently, 25 gurus hold positions in Applied Materials Inc AMAT, with 9 adding to their holdings while 12 have trimmed their positions in recent quarters. This mixed activity reflects a cautious sentiment among institutional investors.
Furthermore, insider activity has shown a notable trend, with insiders selling $169.7M worth of shares in the last three months without any purchases. This pattern may suggest a lack of confidence in the stock's future performance among those closest to the company, which is an important signal for potential investors to consider.
What This Means for Investors
Based on the analysis of the GF Value™, it is clear that Applied Materials Inc AMAT is currently overvalued. The significant gap between the share price and the estimated intrinsic value indicates that investors might face downside risk if the market adjusts to align more closely with the company's underlying fundamentals.
For further insights into Applied Materials Inc AMAT, you can visit the Applied Materials Inc (AMAT) stock page and explore additional valuation metrics on the GF Value™ page.
Frequently Asked Questions
What is AMAT's GF Score™?
AMAT's GF Score™ is 81/100, indicating a strong overall performance compared to its peers, suggesting solid financial health and growth potential.
Is AMAT overvalued or undervalued?
AMAT is currently overvalued, with a GF Value™ of $224.60 compared to a market price of $546.62, indicating a significant overvaluation of 143.4%.
What is AMAT's P/E ratio?
AMAT's P/E ratio (TTM) is 51.3x, which is substantially higher than its 5-year median P/E of 20.4x, confirming its overvaluation status.
This stock alert was generated using automated technology and GuruFocus financial data to provide readers with timely and accurate market reporting. This content was reviewed by GuruFocus editorial team prior to publication. Please send any questions or comments about this story to [email protected].

