


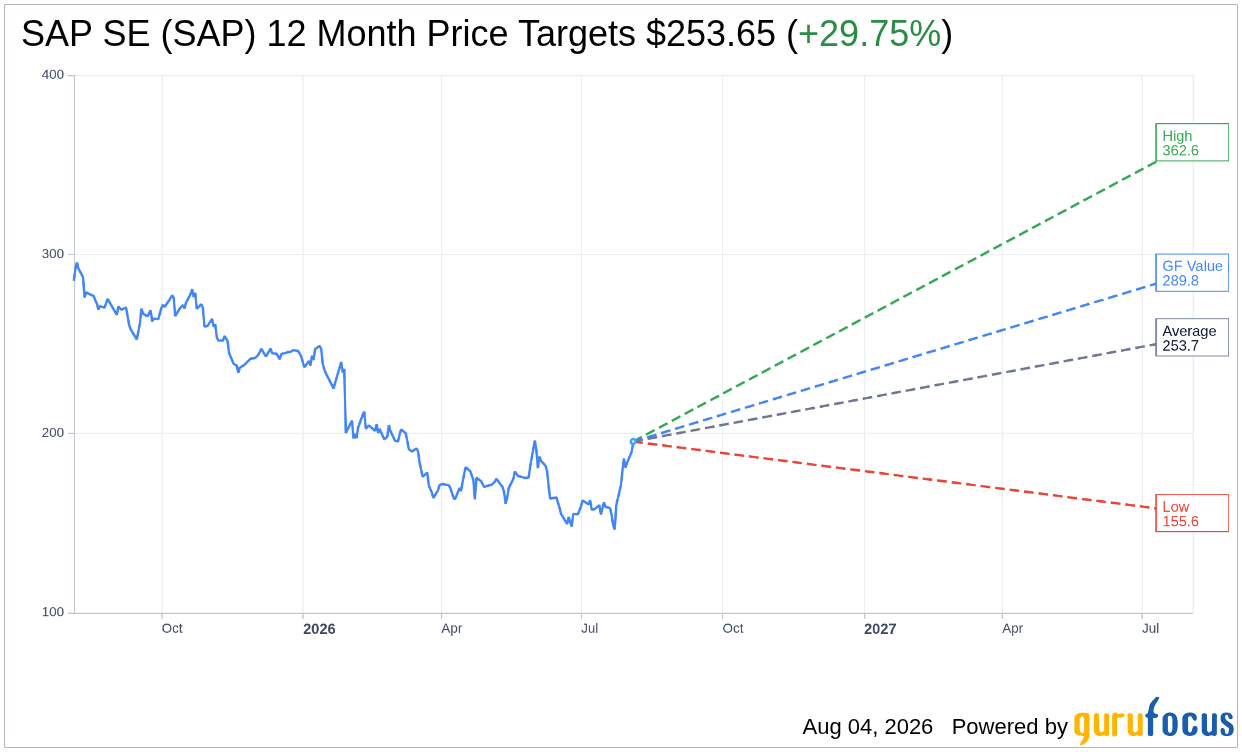
On August 04, 2026, SAP SE SAP shares rose 3.1%, closing at $195.49. This price is within a 52-week range of $144.97 to $299.48, indicating significant volatility in the stock's performance.
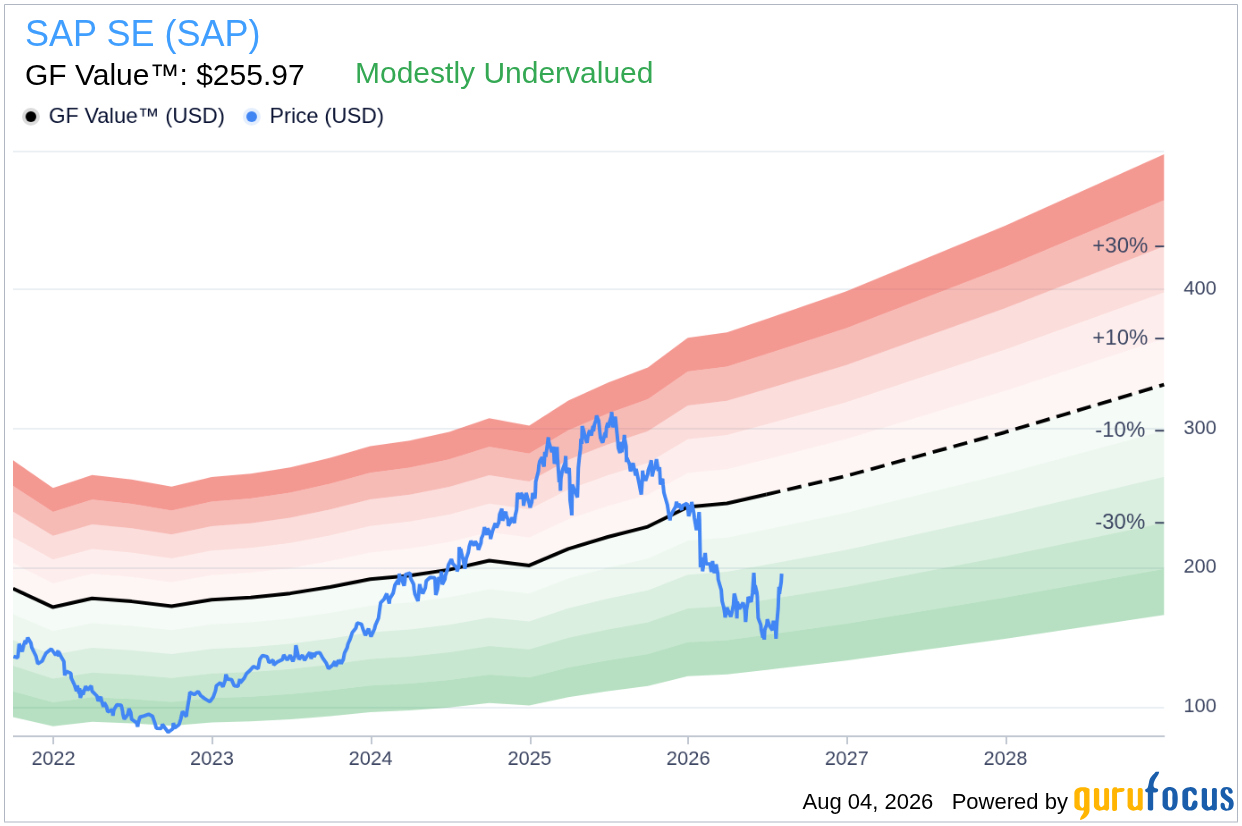
- GF Value™ verdict: SAP's current price of $195.49 is 23.6% below the GF Value™ estimate of $255.97, suggesting it is undervalued.
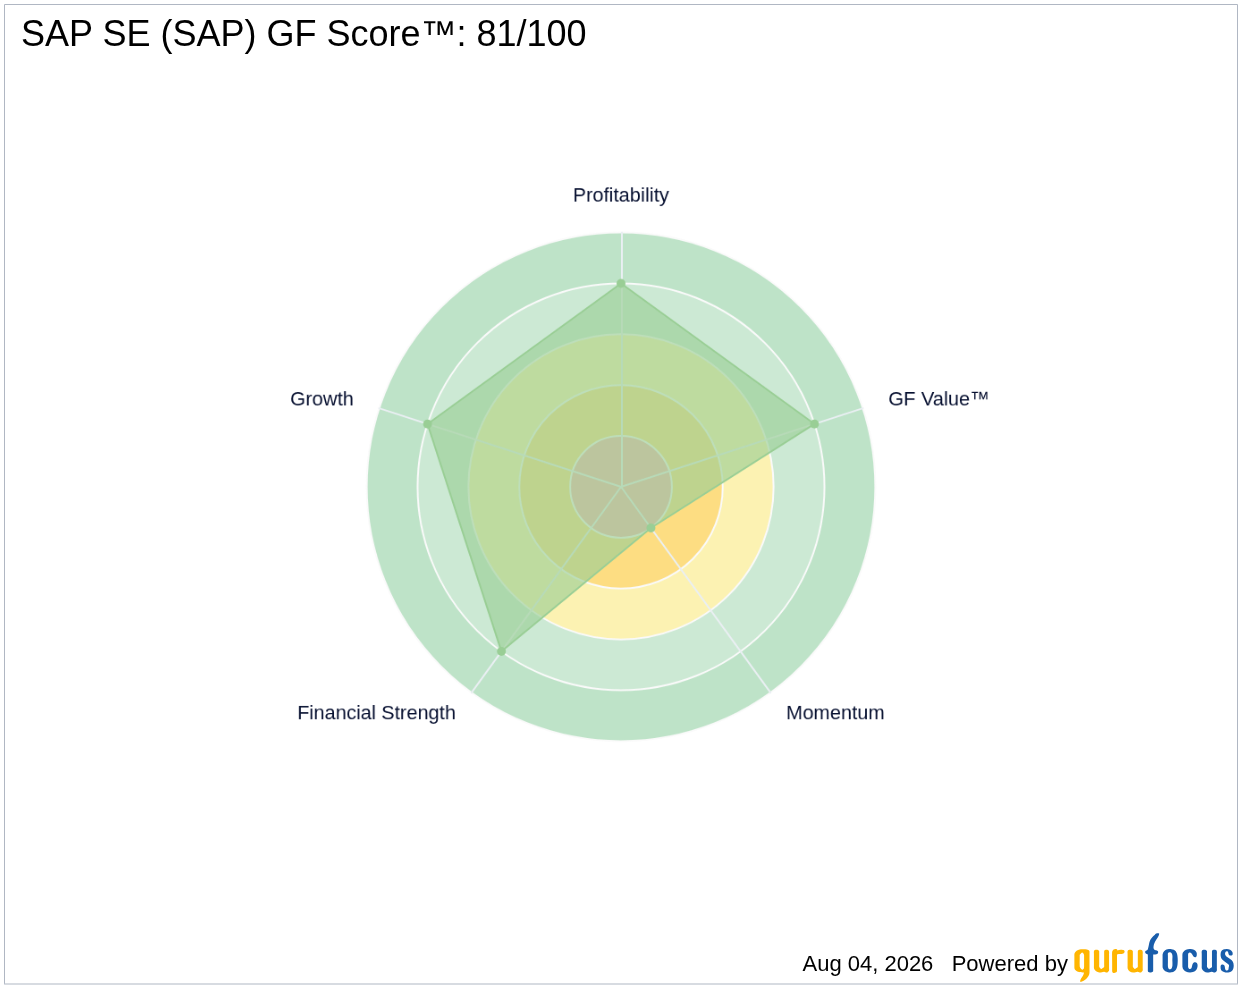
- GF Score™: SAP has a strong GF Score™ of 81/100, indicating solid fundamentals.
- Most notable signal: Financial Strength is rated at 8/10, reflecting a robust balance sheet.
Is SAP Overvalued or Undervalued?
Evaluating SAP's current price against the GF Value™, which represents GuruFocus' proprietary estimate of intrinsic value, reveals that the stock is undervalued. The GF Value™ of $255.97 provides a margin of safety, as the current price of $195.49 is significantly lower, indicating a potential upside of 23.6%. In this context, the term "GF Value™" refers to an assessment that combines historical trading multiples, past business performance, and future growth expectations to derive an intrinsic value for the stock.
Given that SAP is classified as "Modestly Undervalued," this suggests that there is a favorable opportunity for investors to consider. However, it is essential to note that market conditions and company-specific risks can influence future performance, which warrants careful consideration.
How Does SAP's Valuation Compare to Its History?
| Metric | Current | Historical |
|---|---|---|
| P/E (TTM) | 24.7x | 33.6x |
| Forward P/E | 23.7x | N/A |
The current P/E ratio of 24.7x is notably below the 5-year median P/E of 33.6x, which aligns with the GF Value™ assessment of SAP being undervalued. This P/E analysis supports the notion that the stock is trading at a more attractive valuation compared to its historical norms, indicating potential for appreciation as market conditions stabilize.
What Does SAP's GF Score™ Tell Us?
The GF Score™ measures a stock's overall quality based on multiple factors, including financial strength, profitability, growth potential, valuation metrics, and momentum. SAP's robust GF Score™ of 81/100 highlights its strong fundamentals, particularly in financial strength, profitability, and growth.
| Metric | Rating |
|---|---|
| GF Score™ | 81 |
| Financial Strength | 8/10 |
| Profitability | 8/10 |
| Growth | 8/10 |
| Valuation | 8/10 |
| Momentum | 2/10 |
The strong ratings in financial strength, profitability, growth, and valuation indicate that SAP possesses a solid foundation, although its momentum score of 2/10 suggests weaker recent performance. This mixed signal may reflect the volatility observed in the stock over the past year, contrasting with its overall strong fundamentals.
What Are Gurus and Insiders Doing with SAP?
Currently, 13 gurus hold shares of SAP, with 10 increasing their positions and 3 trimming their holdings in recent quarters. This activity indicates a generally positive sentiment among institutional investors, suggesting confidence in the company's future prospects.
There have been no insider transactions in the last three months, which may imply that insiders are either satisfied with the current valuation or waiting for more favorable conditions to buy or sell. Overall, the guru ownership flow and lack of insider activity indicate a cautious but steady interest in SAP's stock, reinforcing its appeal to long-term investors.
What This Means for Investors
In conclusion, SAP appears to be undervalued based on the GF Value™ assessment, with a significant margin of safety compared to its intrinsic value estimate. The robust GF Score™ and favorable guru activity further enhance the stock's attractiveness. For those looking to explore SAP's performance and potential, further details can be found on the SAP SE SAP stock page or the GF Value™ page.Frequently Asked Questions
What is SAP's GF Score™?
SAP's GF Score™ is 81/100, indicating strong overall fundamentals and a solid investment profile.
Is SAP overvalued or undervalued?
SAP is considered undervalued, with a current price of $195.49 being 23.6% below the GF Value™ estimate of $255.97.
What is SAP's P/E ratio?
SAP has a P/E ratio of 24.7x, which is significantly below its 5-year median P/E of 33.6x, suggesting that the stock is trading at a lower valuation compared to its historical averages.
This stock alert was generated using automated technology and GuruFocus financial data to provide readers with timely and accurate market reporting. This content was reviewed by GuruFocus editorial team prior to publication. Please send any questions or comments about this story to [email protected].

