


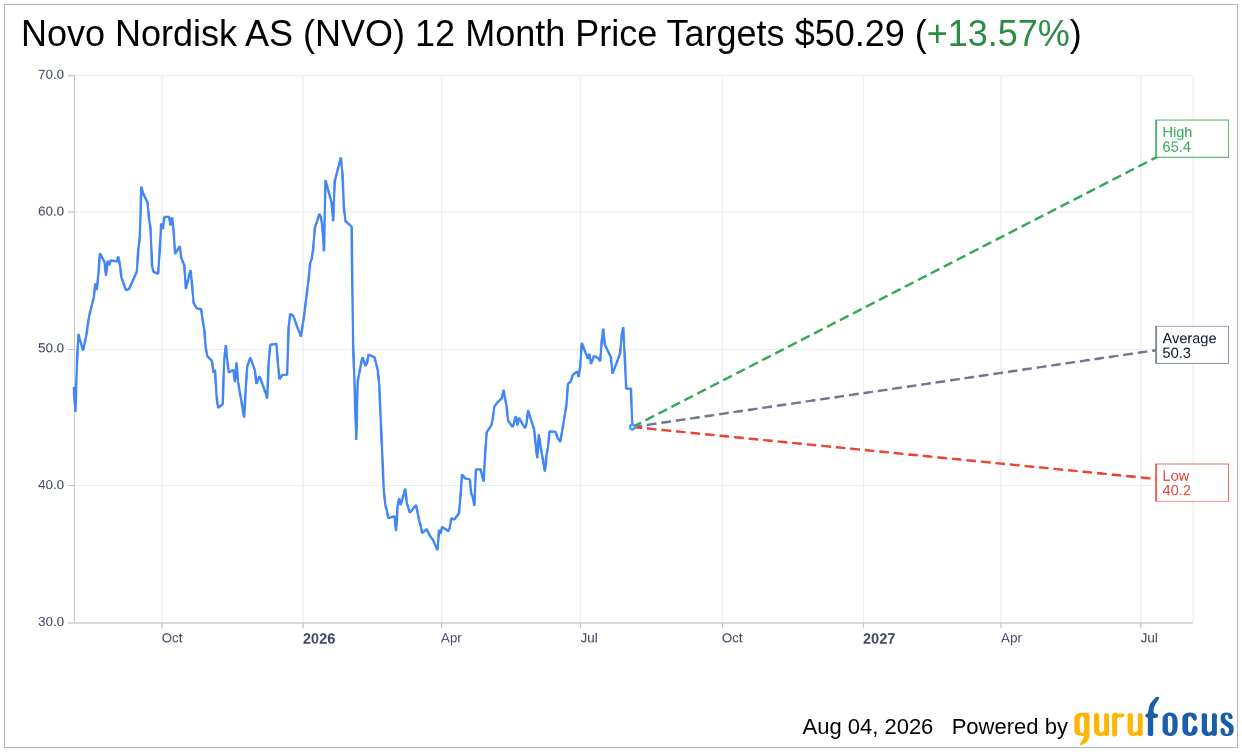
On August 04, 2026, Novo Nordisk AS NVO shares fell 6.0%, closing at $44.28. This decline adds to a challenging price performance, with the stock trading between a 52-week high of $64.16 and a low of $35.12.
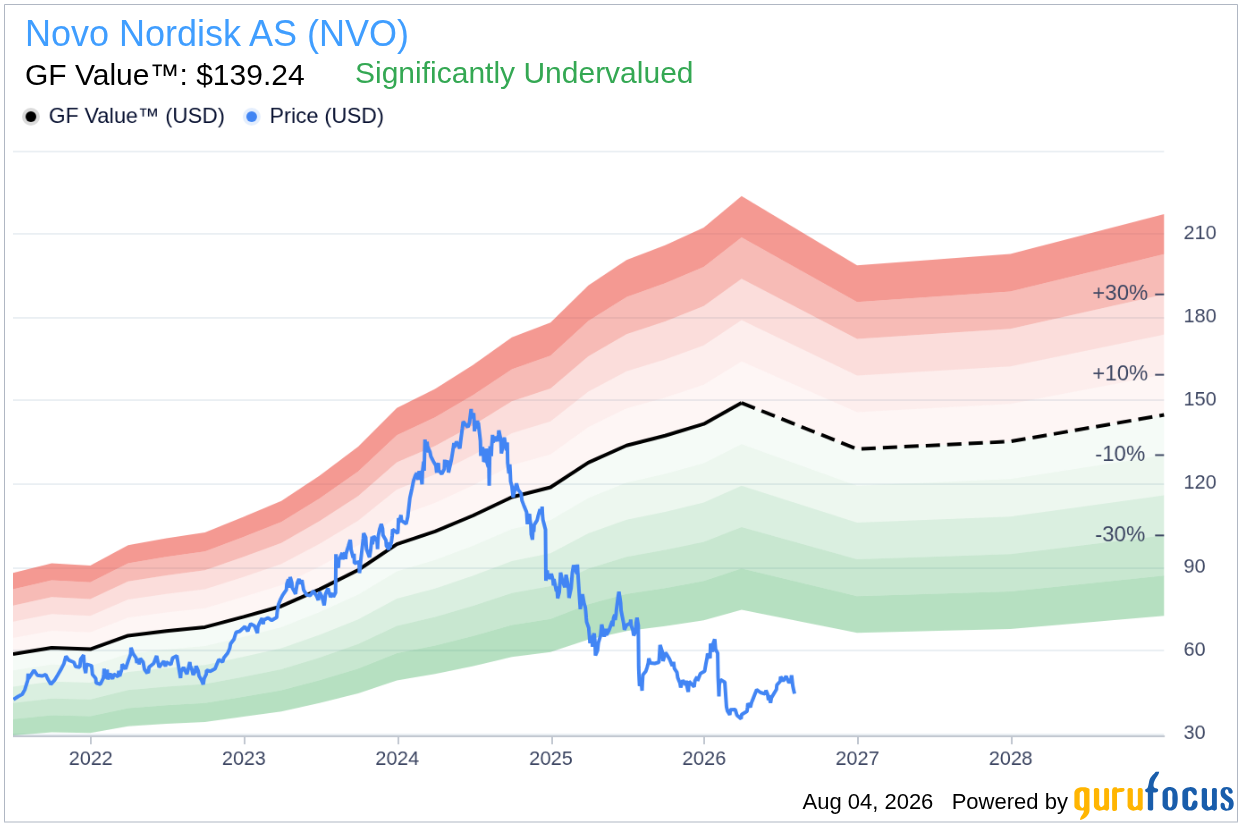
- GF Value™ verdict: Current price of $44.28 is 68.2% below the GF Value™ estimate of $139.24, indicating significant undervaluation.
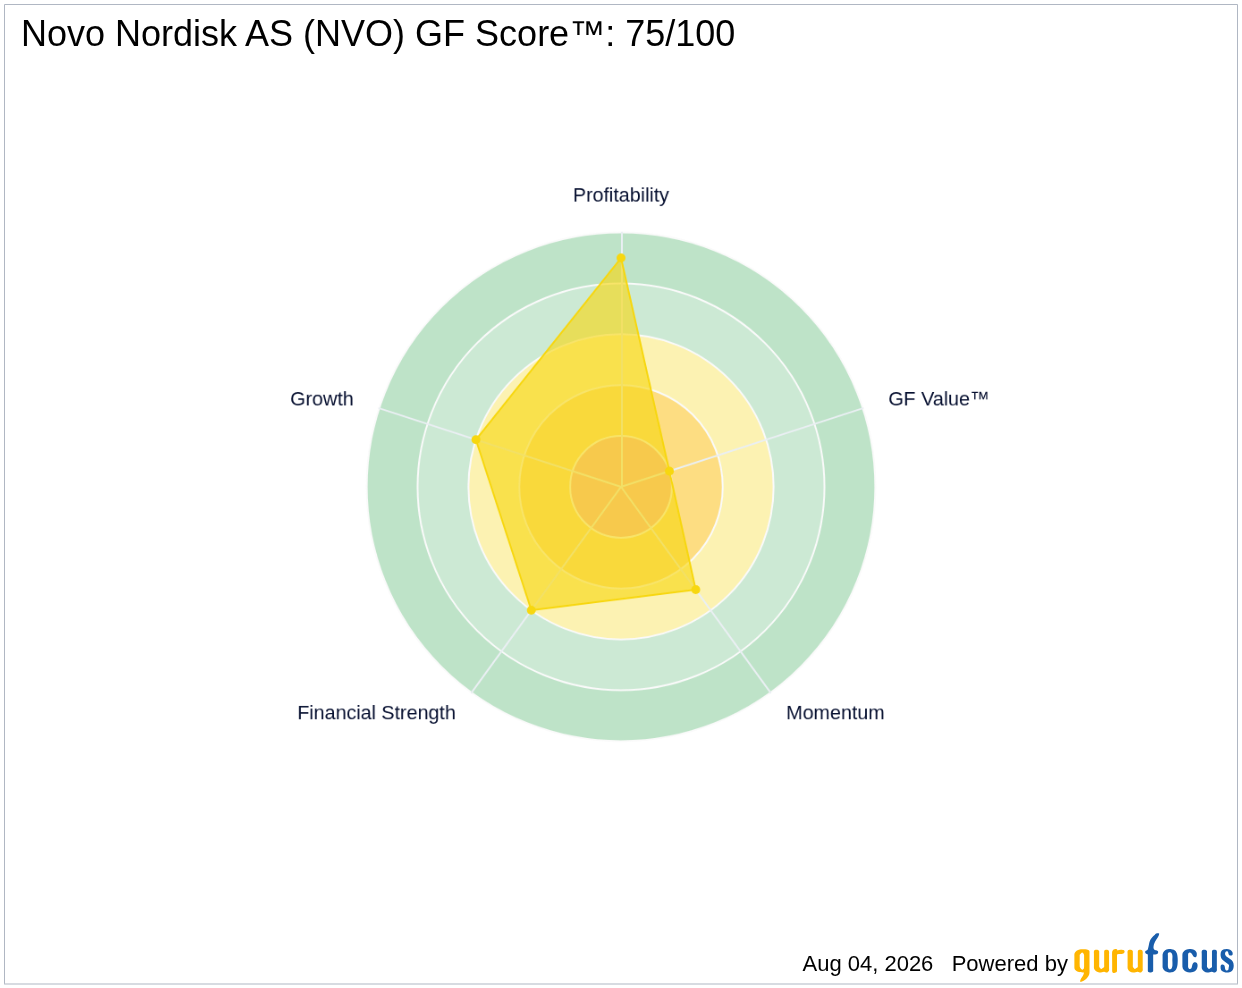
- GF Score™ is 75/100, suggesting the company has above-average financial health and performance metrics.
- Notable signal: No insider transactions in the last 3 months, indicating a stable insider ownership structure.
Is NVO Overvalued or Undervalued?
Based on the GF Value™ assessment, Novo Nordisk AS is significantly undervalued at its current price of $44.28 compared to its estimated fair value of $139.24. This creates a compelling opportunity for investors, as the stock is trading at a 68.2% discount to its intrinsic value. The GF Value™ is derived from a combination of historical trading multiples, the company's past growth patterns, and projected future performance, allowing for a comprehensive view of the stock's potential worth.
The substantial margin of safety suggests that the current price may not accurately reflect the company's fundamentals, highlighting an attractive entry point for potential investors. However, it is essential to consider that while the undervaluation presents a buying opportunity, market conditions and broader economic factors could influence stock performance in the near term.
How Does NVO's Valuation Compare to Its History?
| Metric | Current | Historical |
|---|---|---|
| P/E (TTM) | 10.4x | 35.4x (5-Year Median) |
| Forward P/E | 13.2x | - |
Currently, Novo Nordisk AS has a P/E (TTM) of 10.4x, which is significantly below its 5-year median P/E of 35.4x. This stark contrast indicates that the stock is trading at a much lower valuation compared to its historical performance, aligning with the GF Value™ assessment of being undervalued. The forward P/E of 13.2x also supports the notion that the stock may be positioned for recovery as market conditions stabilize.
What Does NVO's GF Score™ Tell Us?
The GF Score™ evaluates a company's financial health and growth potential based on various factors, including profitability, financial strength, and valuation metrics. Novo Nordisk AS has a GF Score™ of 75/100, indicating a solid position within its industry, with strengths in profitability and a strong economic moat.
| Metric | Rating |
|---|---|
| GF Score™ | 75 |
| Financial Strength | 6/10 |
| Profitability | 9/10 |
| Growth | 6/10 |
| Valuation | 2/10 |
| Momentum | 5/10 |
Examining the GF Score™ reveals that Novo Nordisk AS excels in profitability, scoring 9/10, which is its strongest area. However, it faces challenges in valuation, with a score of just 2/10. This discrepancy highlights the potential for price appreciation if the market starts to recognize the company's underlying value. The financial strength score of 6/10 suggests that while the company is stable, there could be room for improvement to enhance resilience against economic downturns.
What Are Gurus and Insiders Doing with NVO?
A notable aspect of Novo Nordisk AS is its guru ownership, with 13 gurus currently holding the stock. Among these, 8 have increased their positions while 5 have trimmed their holdings in recent quarters. This indicates a generally positive sentiment among knowledgeable investors, which could signal confidence in the company's future performance.
Interestingly, there have been no insider transactions in the last three months, suggesting that insiders are not actively buying or selling shares. This stability can be interpreted as a sign that insiders are confident in the company's long-term prospects, which aligns with the overall positive outlook suggested by the GF Value™ and GF Score™ metrics.
What This Means for Investors
Considering the significant undervaluation highlighted by the GF Value™ assessment, along with a strong profitability rank and favorable guru sentiment, Novo Nordisk AS appears to be an attractive investment opportunity at its current price of $44.28. While the stock is undervalued, investors should remain aware of market dynamics and potential risks that could affect performance in the future. For a complete analysis, visit the Novo Nordisk AS NVO stock page, and explore further insights on the GF Value™ page.
Frequently Asked Questions
What is NVO's GF Score™?
Novo Nordisk AS has a GF Score™ of 75/100, indicating above-average financial health and operational performance.
Is NVO overvalued or undervalued?
According to the GF Value™ assessment, Novo Nordisk AS is significantly undervalued, with the current price being 68.2% lower than its estimated fair value.
What is NVO's P/E ratio?
Novo Nordisk AS has a P/E (TTM) ratio of 10.4x, which is substantially lower than its 5-year median of 35.4x, indicating that the stock is trading at a much lower valuation than in the past.
This stock alert was generated using automated technology and GuruFocus financial data to provide readers with timely and accurate market reporting. This content was reviewed by GuruFocus editorial team prior to publication. Please send any questions or comments about this story to [email protected].

