


On August 04, 2026, Hewlett Packard Enterprise Co HPE shares rose 4.3% today, reaching a current price of $52.39. This price is significantly above the stock's 52-week low of $19.64, but below its 52-week high of $64.25. The stock has experienced a remarkable performance year-to-date, with gains of 120.2% and an impressive increase of 167.1% over the past year.
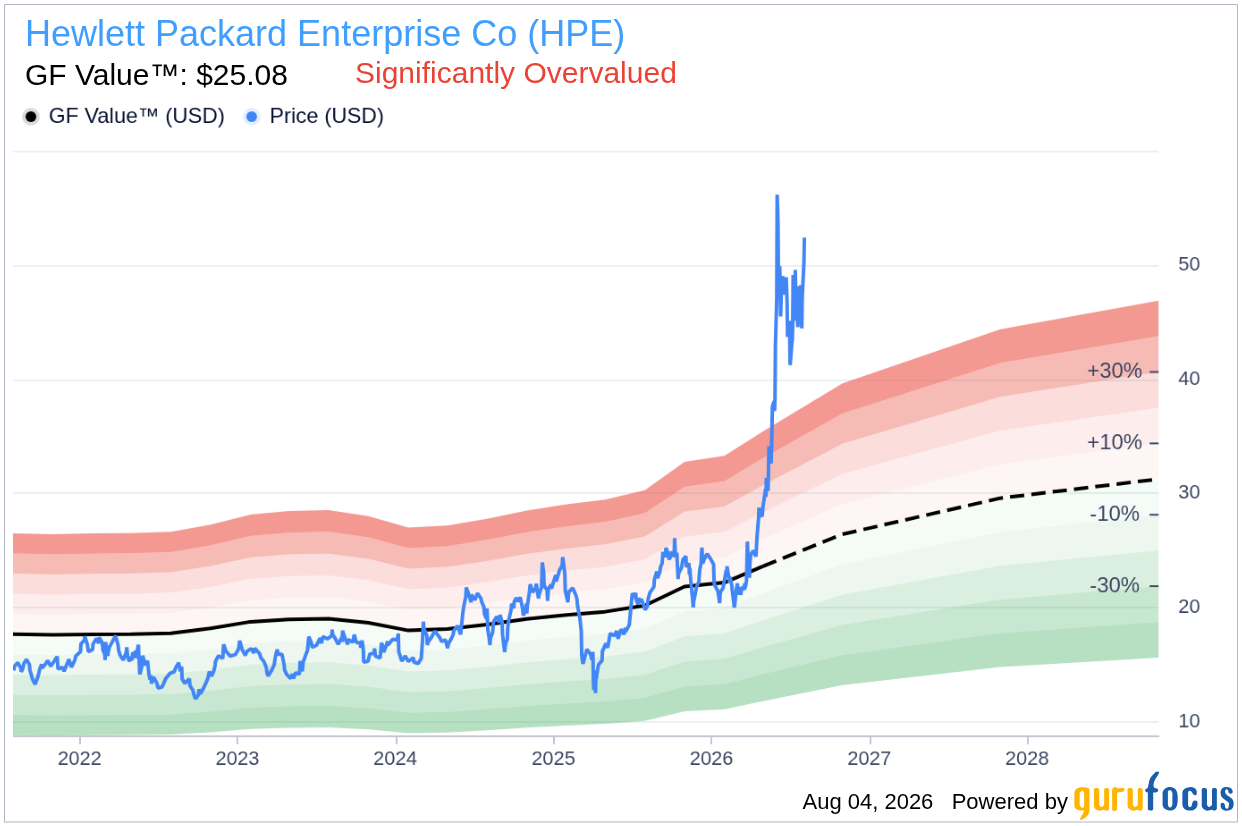
- GF Value™ verdict: Current price is $52.39, indicating a 108.9% overvaluation compared to a GF Value of $25.08.
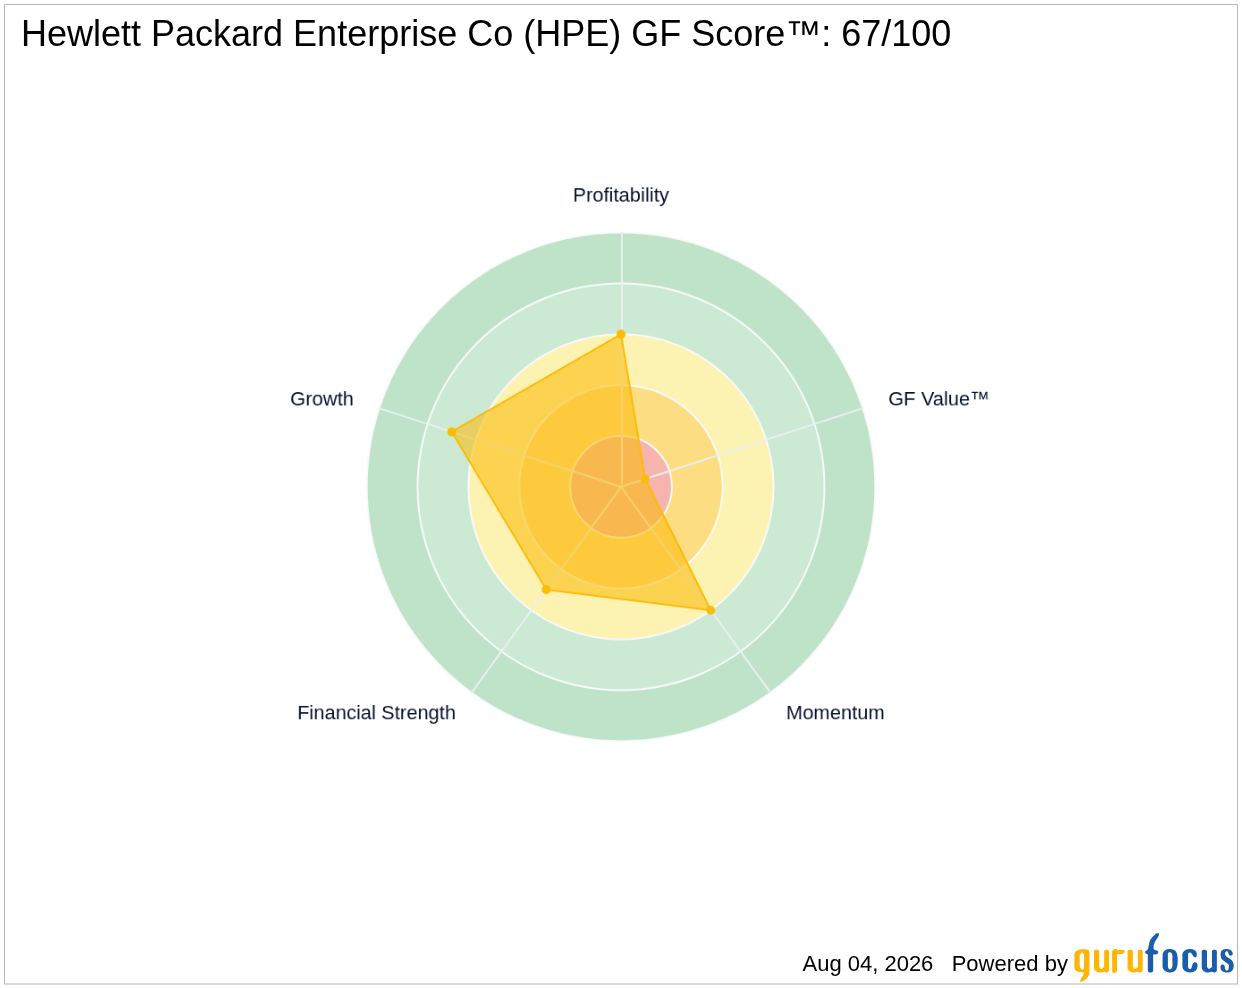
- GF Score™ is 67/100, reflecting an above-average rating.
- Most notable signal: Insiders sold $6.1 million in shares over the last three months, with no buying activity.
Is HPE Overvalued or Undervalued?
According to the GF Value™, Hewlett Packard Enterprise Co HPE is significantly overvalued at its current price of $52.39, which is 108.9% above the estimated fair value of $25.08. The margin of safety is absent, indicating that potential investors may face considerable risk if they enter at current price levels. The GF Value™ is GuruFocus' proprietary intrinsic-value estimate, which is derived from historical trading multiples, past business growth, and future performance projections. The high valuation suggests that the stock may be overpriced relative to its historical performance and future potential.
The GF Valuation label categorizes HPE as significantly overvalued, reinforcing the notion that the current stock price may not be justified by the underlying fundamentals. This situation should raise caution for potential buyers, as entering at inflated levels could lead to losses if the stock price corrects to align more closely with its intrinsic value.
How Does HPE's Valuation Compare to Its History?
| Metric | Current | Historical |
|---|---|---|
| P/E (TTM) | 49.0x | 14.2x (5-Year Median) |
| Forward P/E | 12.9x | N/A |
Hewlett Packard Enterprise's current P/E ratio of 49.0x is significantly higher than its 5-year median P/E of 14.2x, indicating that the stock is trading at a premium compared to its historical valuation metrics. This discrepancy aligns with the GF Value™ verdict, suggesting that the stock is overvalued based on traditional valuation metrics.
What Does HPE's GF Score™ Tell Us?
The GF Score™ measures a company's financial strength and growth potential, combining various metrics to provide an overall rating. HPE's GF Score™ stands at 67/100, indicating an above-average performance in comparison to its peers. The strongest sub-rank is the Growth Rank at 7/10, reflecting a positive outlook on the company's growth prospects. Conversely, the Valuation Rank is notably weak at 1/10, further underscoring the overvaluation concerns.
| Metric | Rating |
|---|---|
| GF Score™ | 67/100 |
| Financial Strength | 5/10 |
| Profitability | 6/10 |
| Growth | 7/10 |
| Valuation | 1/10 |
| Momentum | 6/10 |
The combination of HPE's GF Score™ and its sub-ranks suggests that while the company demonstrates solid growth potential, its valuation is a significant concern. The moderate scores in Financial Strength and Profitability indicate that while the company is stable, the valuation metrics signal a need for caution among potential investors.
What Are Gurus and Insiders Doing with HPE?
Currently, 14 gurus hold shares of HPE, with 6 adding to their positions and 9 trimming their stakes in recent quarters. This mixed signal indicates a cautious approach among institutional investors. However, insider activity reveals a more concerning trend, as insiders sold $6.1 million worth of shares over the last three months without any buying activity. This could suggest a lack of confidence from those closest to the company, which is an important signal for potential investors to consider.
The insider selling trend, combined with the mixed actions from gurus, may imply that while some institutional investors see potential in HPE, insiders are opting to reduce their exposure. This pattern raises questions about the sustainability of the current stock price and the company's future performance.
What This Means for Investors
In summary, Hewlett Packard Enterprise Co HPE appears to be overvalued based on the GF Value™ assessment, with a significant margin of risk for potential buyers. The high current P/E ratio and the concerning insider selling activity further underscore the need for caution. Investors may want to consider these factors carefully before making any decisions regarding HPE shares.
For more details on HPE's performance and valuation metrics, visit the Hewlett Packard Enterprise Co HPE stock page and explore further insights on the GF Value™ page.
Frequently Asked Questions
What is HPE's GF Score™?
HPE's GF Score™ is 67/100, indicating an above-average performance relative to its peers and suggesting a mix of growth potential and valuation concerns.
Is HPE overvalued or undervalued?
HPE is overvalued according to the GF Value™, with a current price significantly above its estimated fair value.
What is HPE's P/E ratio?
HPE's P/E (TTM) is 49.0x, which is substantially higher than its 5-year median P/E of 14.2x, indicating that the stock is trading at a premium compared to its historical valuation.
This stock alert was generated using automated technology and GuruFocus financial data to provide readers with timely and accurate market reporting. This content was reviewed by GuruFocus editorial team prior to publication. Please send any questions or comments about this story to [email protected].

