

On August 04, 2026, Hubbell Inc HUBB shares
rose 5.5% today, reaching a current price of $502.24. The stock has shown considerable strength in the past year, trading within a 52-week range of $403.82 to $565.50.- GF Value™ verdict: Currently priced at $502.24, HUBB is estimated to be 4.8% overvalued compared to its GF Value™ of $479.21.
- GF Score™ of 92/100 indicates a strong investment potential based on multiple factors.
- No insider transactions in the last 3 months suggest a stable ownership structure.
Is HUBB Overvalued or Undervalued?
Hubbell Inc's current price of $502.24 is slightly above its GF Value™ of $479.21, indicating that the stock is approximately 4.8% overvalued. The GF Value™ is an intrinsic value estimate derived from a combination of historical trading multiples, past business growth, and projections of future performance. Given that the stock is trading above its estimated fair value, there is a relatively limited margin of safety for potential investors. Investors should be cautious as the overvaluation poses risks if market conditions change or if the company fails to meet growth expectations.Despite the overvaluation, the GF Valuation label categorizes HUBB as "Fairly Valued," which suggests that while there is current risk, the company has a strong performance history and favorable growth prospects that may justify the price. It is important for stakeholders to keep an eye on the company's performance and market dynamics to reassess this valuation.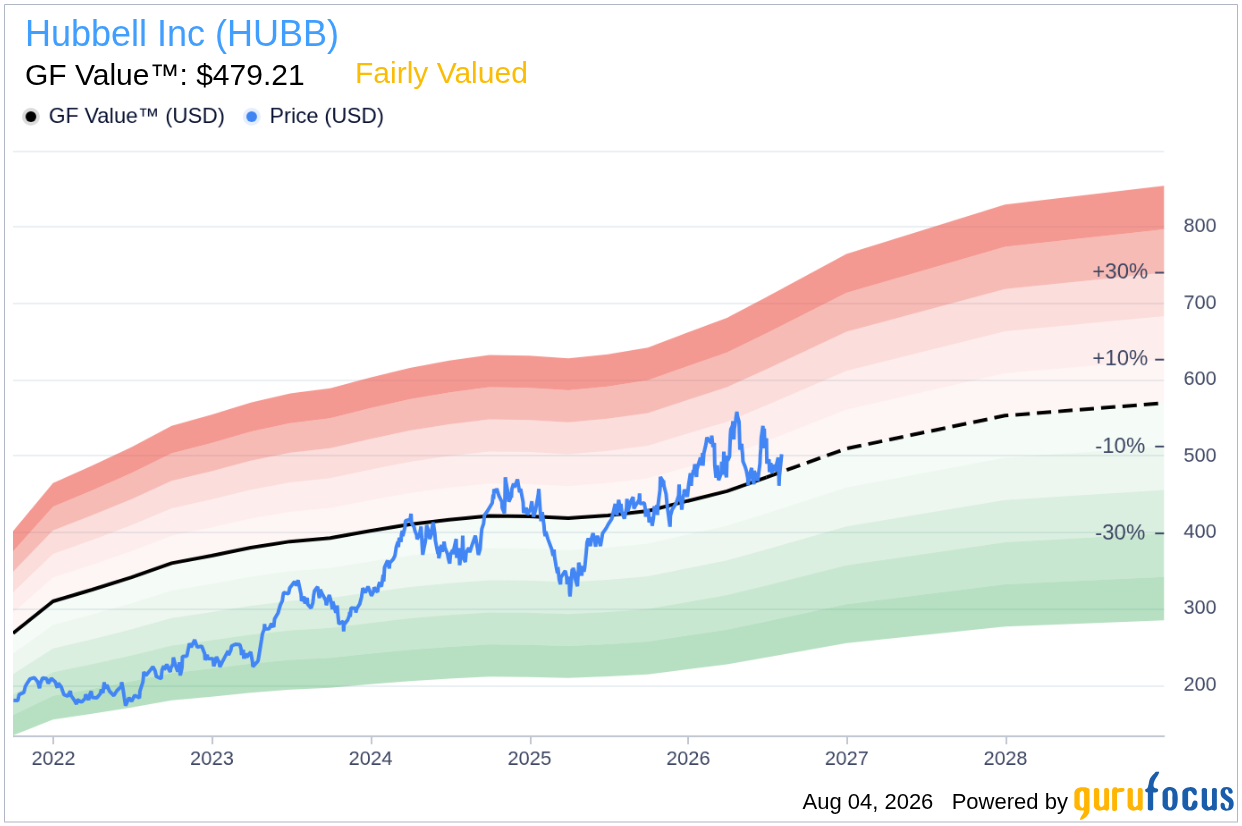
How Does HUBB's Valuation Compare to Its History?
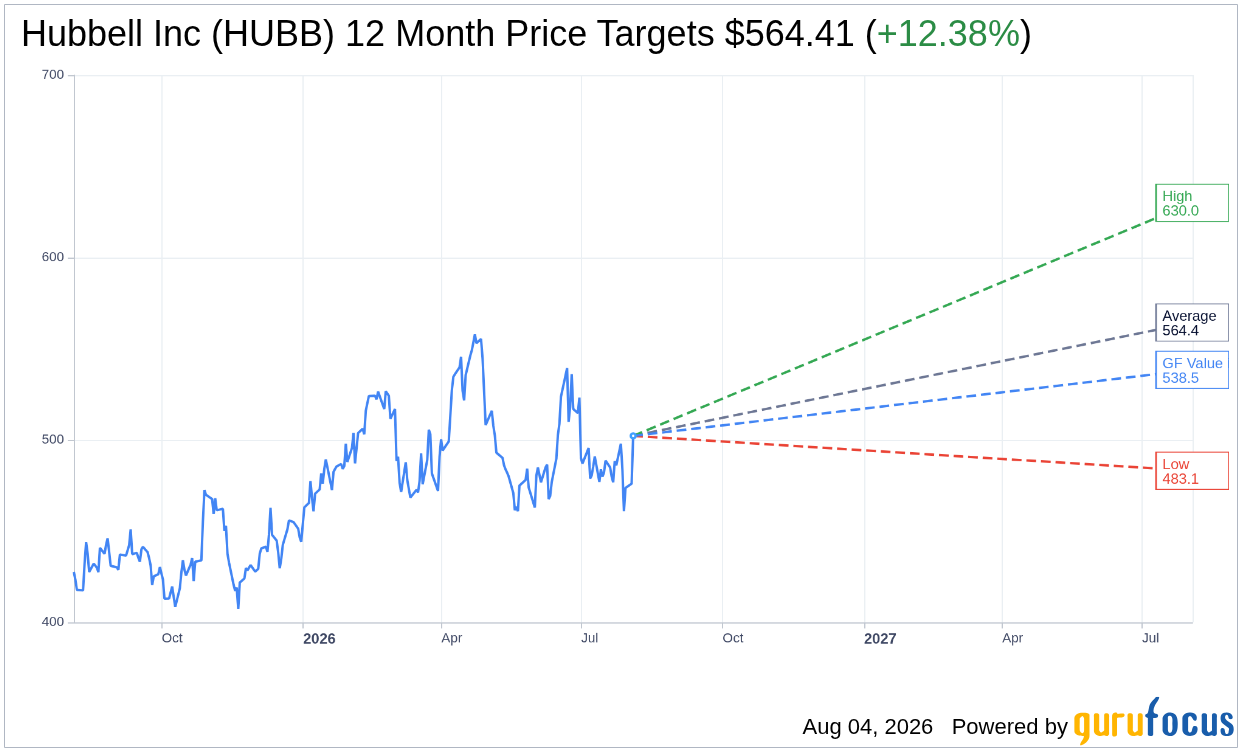
To provide further context, we can compare HUBB's current price-to-earnings (P/E) ratio to its historical averages. The following table summarizes these metrics:| Metric | Current | Historical |
|---|---|---|
| P/E (TTM) | 29.7x | 27.2x |
| Forward P/E | 24.8x | - |
What Does HUBB's GF Score™ Tell Us?
The GF Score™ is a comprehensive metric that evaluates a company's financial health, profitability, growth potential, valuation, and momentum. Hubbell Inc's GF Score™ of 92/100 reflects its strong performance across multiple dimensions.| Metric | Rating |
|---|---|
| GF Score™ | 92 |
| Financial Strength | 5/10 |
| Profitability | 9/10 |
| Growth | 9/10 |
| Valuation | 9/10 |
| Momentum | 8/10 |
What Are Gurus and Insiders Doing with HUBB?
Currently, 14 gurus hold shares of Hubbell Inc, with 8 adding to their positions while 5 have trimmed their holdings in recent quarters. This level of guru interest reflects confidence in the company’s potential, as a majority of gurus are choosing to increase their stakes.In terms of insider activity, there have been no transactions in the last three months, which may suggest that insiders are content with their current holdings and do not anticipate significant changes in the near term. The lack of insider buying could also suggest that insiders do not view the stock as undervalued at current prices.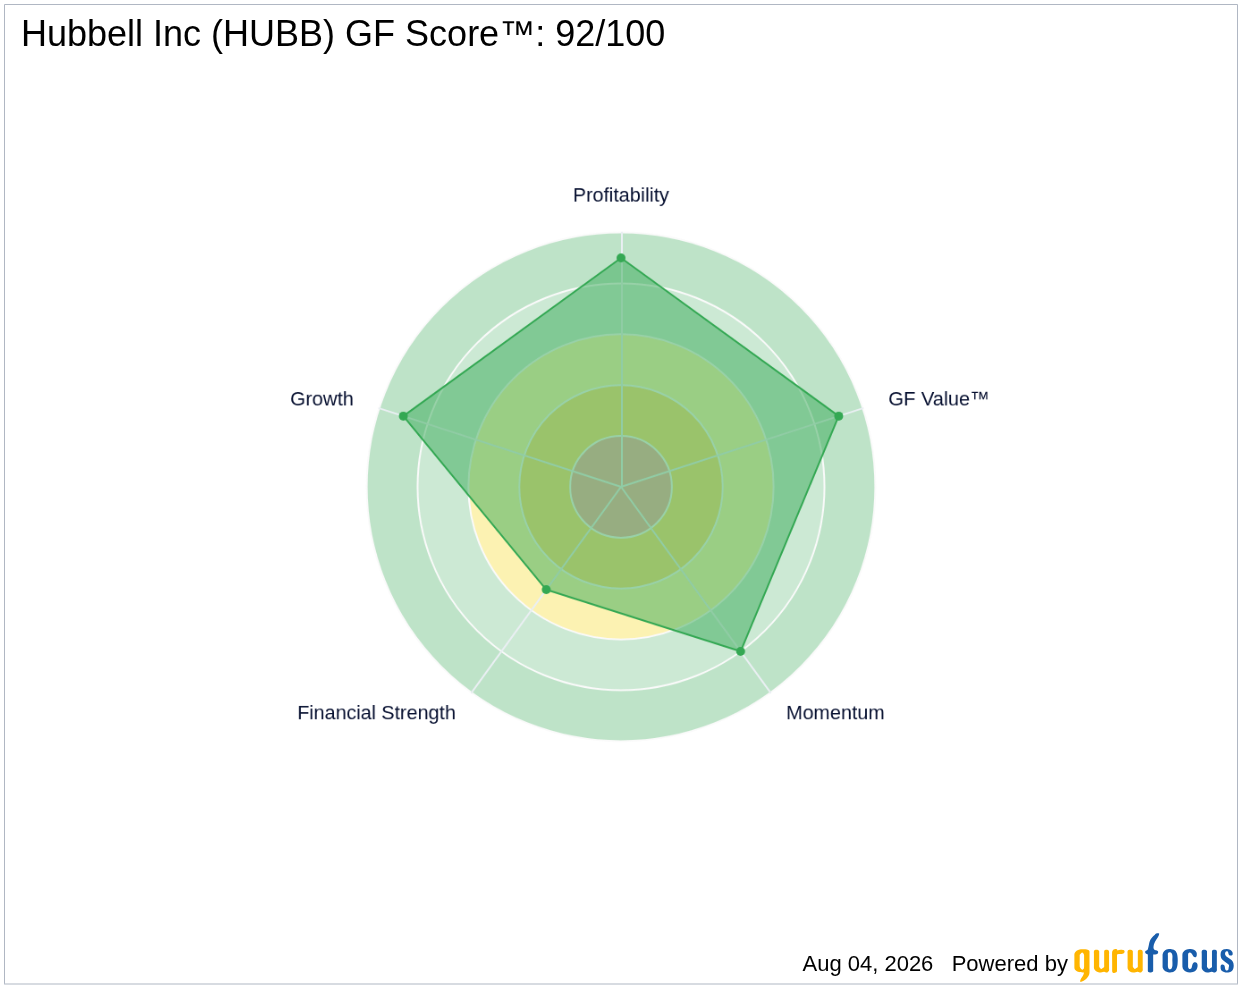
What This Means for Investors
Overall, based on the GF Value™ assessment, Hubbell Inc HUBB is currently overvalued, trading at a premium compared to its estimated fair value. While the company's strong GF Score™ and positive growth metrics indicate robust operational performance, the current valuation poses risks. Investors should remain vigilant and consider potential market fluctuations that may affect HUBB’s stock price. For a deeper dive into HUBB's metrics and performance, visit the Hubbell Inc (HUBB) stock page.Frequently Asked Questions
What is HUBB's GF Score™?
The GF Score™ for Hubbell Inc is 92/100, indicating a strong investment potential based on various financial metrics.
Is HUBB overvalued or undervalued?
Hubbell Inc is currently overvalued, with a GF Value™ of $479.21 compared to its market price of $502.24.
What is HUBB's P/E ratio?
The current P/E ratio for HUBB is 29.7x, which is above its 5-year median of 27.2x, suggesting it is trading at a premium compared to its historical valuations.
This stock alert was generated using automated technology and GuruFocus financial data to provide readers with timely and accurate market reporting. This content was reviewed by GuruFocus editorial team prior to publication. Please send any questions or comments about this story to [email protected].

