


On August 04, 2026, Rentokil Initial PLC RTO shares rose 5.1% today, closing at $25.06. The stock has seen significant volatility in the past month, with a 52-week range of $23.26 to $34.67.
- GF Value™ verdict: Current price of $25.06 is 15.8% below the GF Value™ estimate of $29.75.
- GF Score™: 82/100, indicating a strong overall rating.
- Most notable signal: No insider transactions recorded in the last 3 months.
Is RTO Overvalued or Undervalued?
The current price of Rentokil Initial PLC RTO at $25.06 suggests that the stock is undervalued when compared to the GF Value™ estimate of $29.75, representing a 15.8% upside potential. GF Value™ is GuruFocus' proprietary intrinsic-value estimate that takes into account historical trading multiples, prior business growth, and anticipated future performance. Given this assessment, RTO appears to be a modestly undervalued asset, presenting a potential opportunity for cautious investors. However, it is essential to understand the market conditions and economic factors that could influence the stock price moving forward.
While the GF Valuation label indicates that RTO is modestly undervalued, investors should weigh this assessment against the inherent risks in the business and the market environment. The valuation reflects a margin of safety that could be attractive, but careful consideration of broader market dynamics is essential.
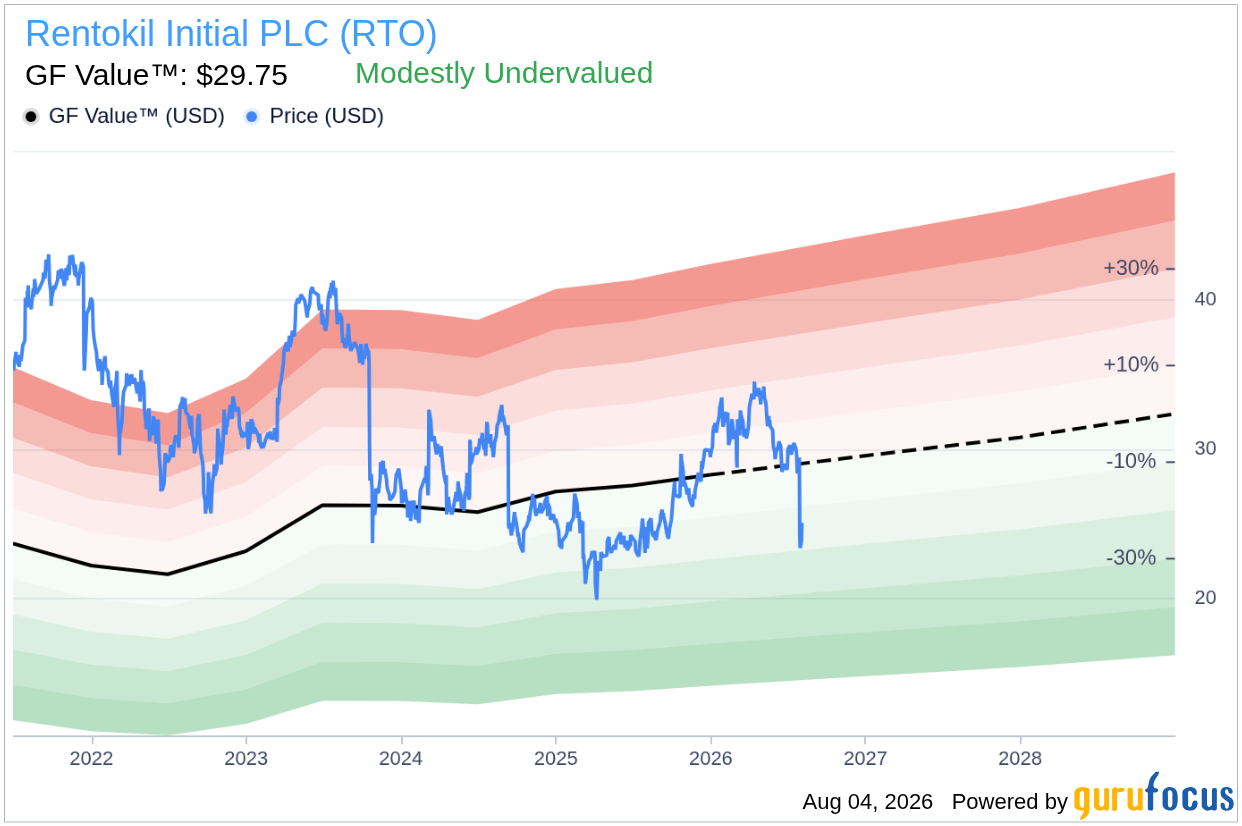
How Does RTO's Valuation Compare to Its History?
| Metric | Current | Historical |
|---|---|---|
| P/E (TTM) | 27.0x | 34.3x |
| Forward P/E | 32.3x | N/A |
RTO's current P/E (TTM) of 27.0x is significantly below its 5-year median of 34.3x, indicating that the stock is trading at a lower valuation compared to its historical levels. This analysis aligns with the GF Value™ verdict, supporting the notion that RTO is currently undervalued.
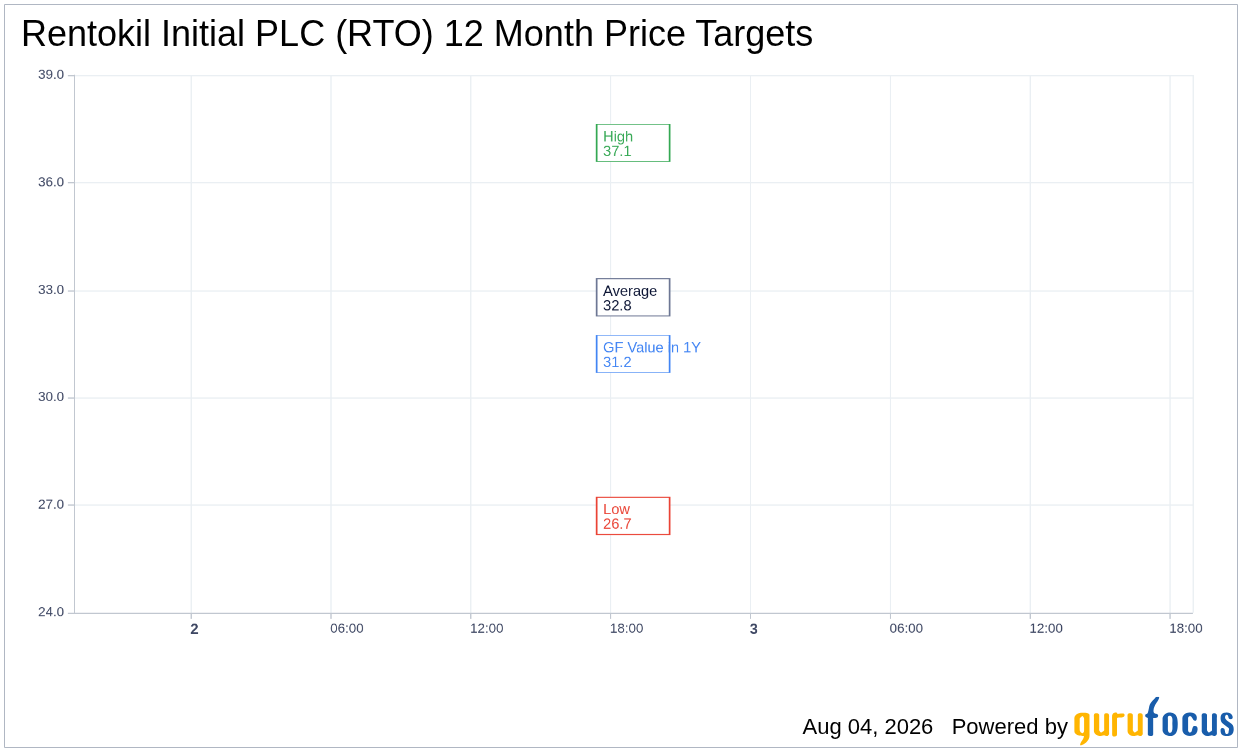
What Does RTO's GF Score™ Tell Us?
The GF Score™ is a comprehensive measure that evaluates a stock's potential based on various factors, including financial strength, profitability, growth, valuation, and momentum. RTO's GF Score™ of 82/100 highlights its overall strong performance, with notable strengths in valuation and momentum, while its financial strength ranks lower.
| Metric | Rating |
|---|---|
| GF Score™ | 82/100 |
| Financial Strength | 5/10 |
| Profitability | 7/10 |
| Growth | 7/10 |
| Valuation | 8/10 |
| Momentum | 7/10 |
The strongest area for RTO is its valuation rank of 8/10, reflecting favorable pricing compared to historical data. However, the financial strength score of 5/10 indicates potential vulnerabilities that investors should consider. Overall, the score suggests that while RTO holds promise, it is prudent to evaluate its financial stability closely.
What Are Gurus and Insiders Doing with RTO?
Currently, three gurus hold RTO, with two adding to their positions and two trimming their holdings in recent quarters. This mixed activity among renowned investors may point to diverse perspectives on the stock's potential.
There have been no insider transactions in the last three months, suggesting that insiders are not currently buying or selling shares, which may indicate a level of confidence or uncertainty within the company's leadership regarding its future performance.
What This Means for Investors
Based on the current assessment, Rentokil Initial PLC RTO appears to be undervalued according to the GF Value™, providing a potential opportunity for investors seeking exposure to a dividend stock with sustainable attributes. However, attention should be paid to the company's financial strength and market conditions. For more detailed insights, visit the Rentokil Initial PLC (RTO) stock page and explore the GF Value™ page for further analysis.
Frequently Asked Questions
What is RTO's GF Score™?
RTO's GF Score™ is 82/100, indicating a strong overall rating based on various fundamental factors.
Is RTO overvalued or undervalued?
RTO is considered undervalued, with a GF Value™ estimate of $29.75 compared to the current price of $25.06.
What is RTO's P/E ratio?
RTO's P/E (TTM) is 27.0x, which is significantly below its 5-year median P/E of 34.3x.
This stock alert was generated using automated technology and GuruFocus financial data to provide readers with timely and accurate market reporting. This content was reviewed by GuruFocus editorial team prior to publication. Please send any questions or comments about this story to [email protected].

