


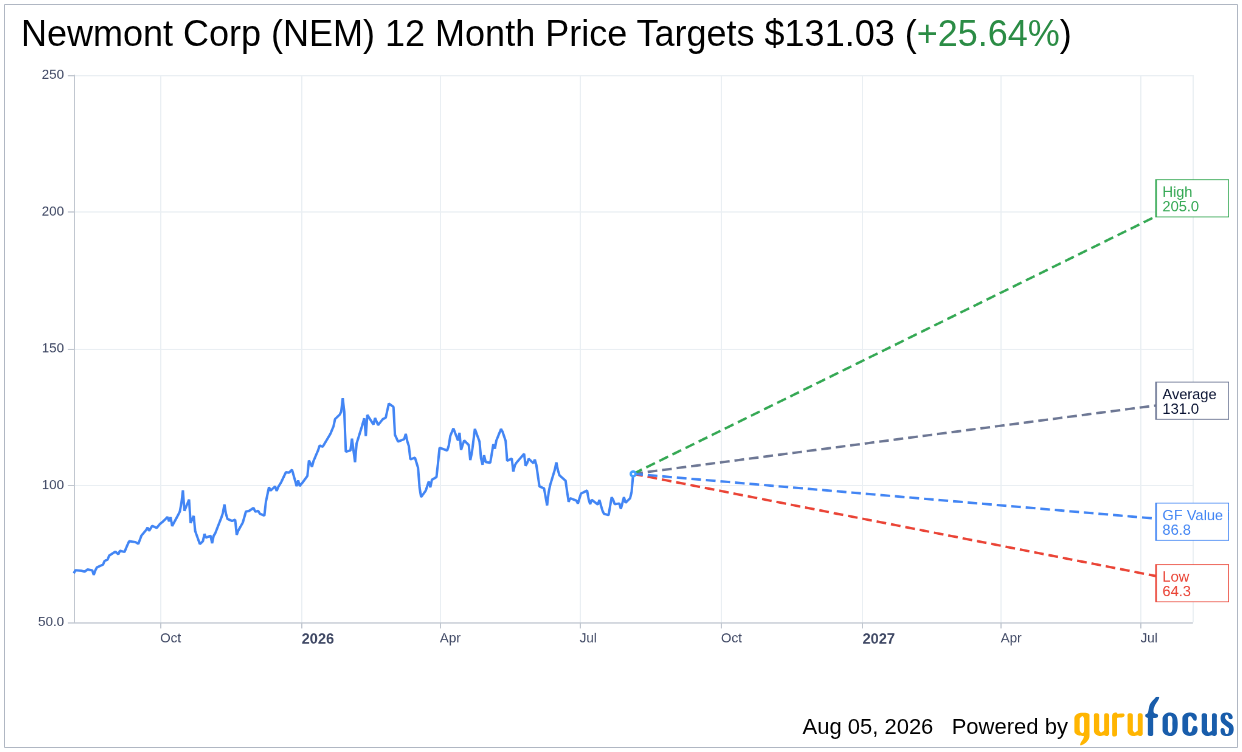
On August 05, 2026, Newmont Corp NEM shares rose 6.7% to a current price of $104.29, reflecting a strong performance amid a 52-week trading range of $64.96 to $134.88.
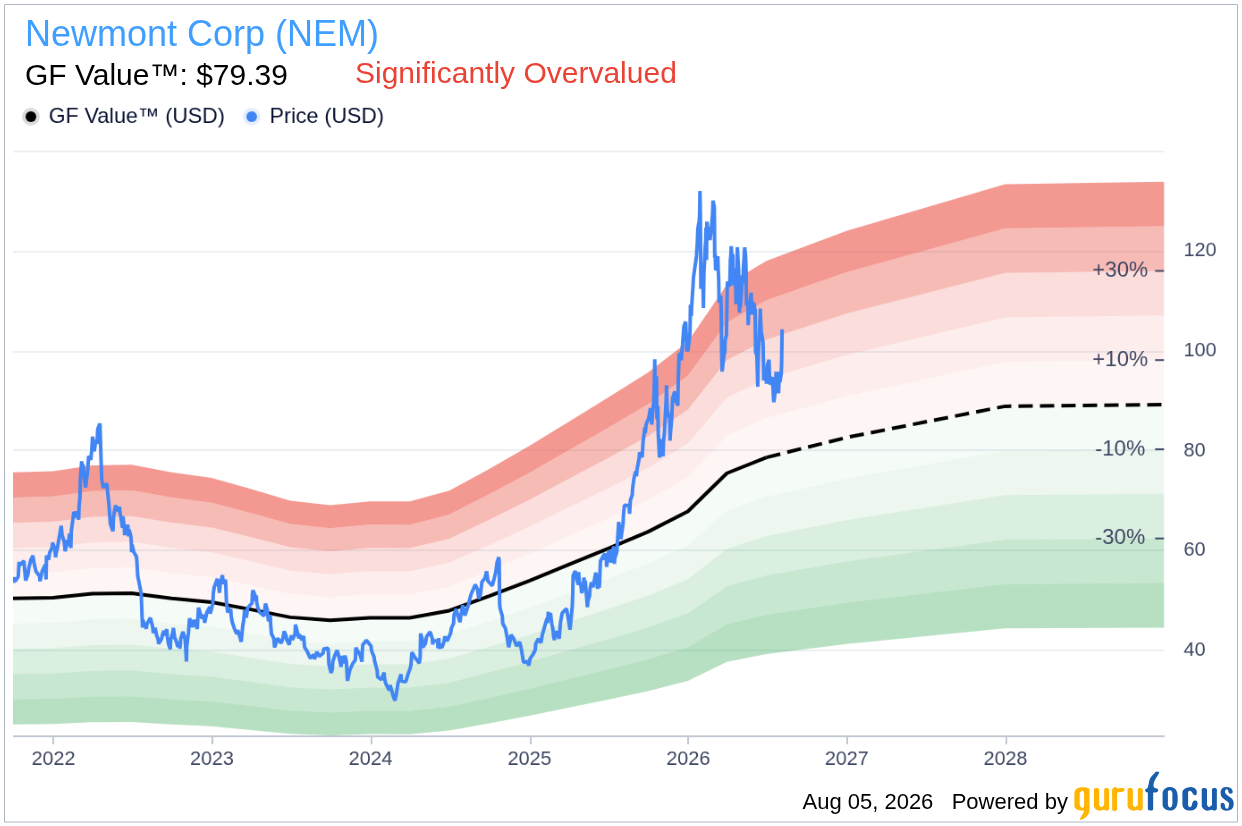
- GF Value™ verdict: Current price is $104.29, which is 31.4% overvalued compared to the GF Value of $79.39.
- GF Score™ of 86/100 indicates a strong overall performance, suggesting the company has solid fundamentals.
- Most notable signal: Insiders sold $1.0M worth of shares in the last three months, indicating a lack of buying interest from management.
Is NEM Overvalued or Undervalued?
According to GuruFocus, Newmont Corp NEM is significantly overvalued, with a GF Value™ of $79.39 compared to its current price of $104.29. This indicates a 31.4% overvaluation, suggesting that the stock may not provide a sufficient margin of safety for potential investors. The GF Value™ is GuruFocus' proprietary estimate of intrinsic value, which is derived from historical trading multiples, past business growth, and future performance estimates. The overvaluation presents a risk, as investors may face potential declines if the stock price adjusts downward towards its estimated fair value.
The current price being significantly above the GF Value™ places NEM in a precarious position, potentially subjecting it to market corrections. Investors should be cautious given that the stock's price has surged recently, possibly driven by short-term market momentum rather than long-term value creation.
How Does NEM's Valuation Compare to Its History?
| Metric | Current | Historical |
|---|---|---|
| P/E (TTM) | 13.2x | 16.5x |
| Forward P/E | 11.2x | N/A |
NEM's current P/E ratio of 13.2x is notably below its 5-year median P/E of 16.5x, indicating that the stock is trading at a lower valuation compared to its historical average. However, this lower P/E does not align with the GF Value™ verdict, which deems the stock as overvalued. Thus, while there may be historical valuation support, the current market price suggests that investors are paying a premium over what the intrinsic value would suggest.
What Does NEM's GF Score™ Tell Us?
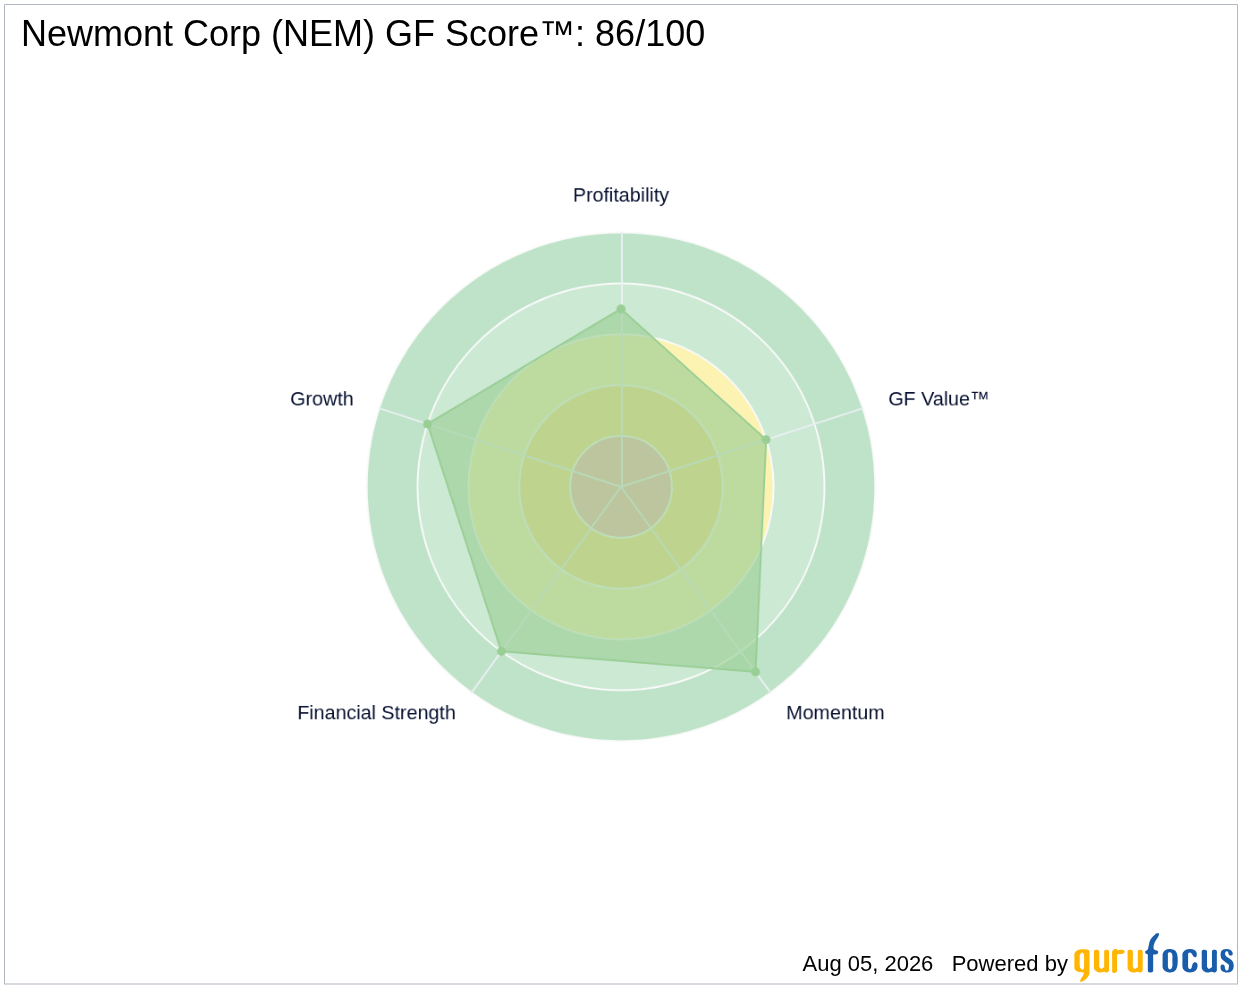
The GF Score™ evaluates a company's financial strength, profitability, growth potential, valuation, and momentum to provide an overall score that reflects its investment quality. Newmont Corp's GF Score™ of 86/100 demonstrates strong fundamentals, with notable strengths in its financial strength (8/10) and growth (8/10) sub-ranks. However, its valuation rank sits at 6/10, suggesting that while the company performs well operationally, its stock price may not reflect its intrinsic value.
| Metric | Rating |
|---|---|
| GF Score™ | 86/100 |
| Financial Strength | 8/10 |
| Profitability | 7/10 |
| Growth | 8/10 |
| Valuation | 6/10 |
| Momentum | 9/10 |
The overall strong GF Score™ reflects Newmont's solid financial health and growth capabilities, though the moderate valuation rank indicates caution regarding its current price level. The high momentum rank of 9/10 suggests that the stock has recently performed well, but this could be misleading if the valuation is not justified by fundamentals.
What Are Gurus and Insiders Doing with NEM?
Currently, 15 gurus hold shares of Newmont Corp NEM, with 6 adding to their positions while 7 have trimmed theirs in recent quarters. This mixed activity among guru investors indicates a cautious approach towards the stock, which reflects the concern over its current valuation.
In terms of insider activity, insiders have sold $1.0M worth of shares over the past three months without any buying activity. This trend suggests a lack of confidence from management regarding the stock's current valuation, which could be a red flag for potential investors. The absence of insider buying further emphasizes the caution surrounding NEM's elevated price levels.
What This Means for Investors
In summary, Newmont Corp NEM is currently overvalued based on the GF Value™ analysis, with a price of $104.29 that exceeds the estimated fair value of $79.39 by 31.4%. This presents a potential risk for investors looking to enter or maintain positions in the stock given the lack of buying from insiders and the mixed signals from guru investors. For further analysis, readers can visit the Newmont Corp (NEM) stock page for additional insights on its performance and valuation.
Frequently Asked Questions
What is NEM's GF Score™?
NEM's GF Score™ is 86/100, indicating strong overall performance and solid fundamentals compared to its peers.
Is NEM overvalued or undervalued?
NEM is considered overvalued, with a GF Value™ of $79.39 compared to its current price of $104.29.
What is NEM's P/E ratio?
NEM's P/E ratio is 13.2x, which is below its 5-year median of 16.5x, indicating it is trading at a lower valuation historically.
This stock alert was generated using automated technology and GuruFocus financial data to provide readers with timely and accurate market reporting. This content was reviewed by GuruFocus editorial team prior to publication. Please send any questions or comments about this story to [email protected].

