


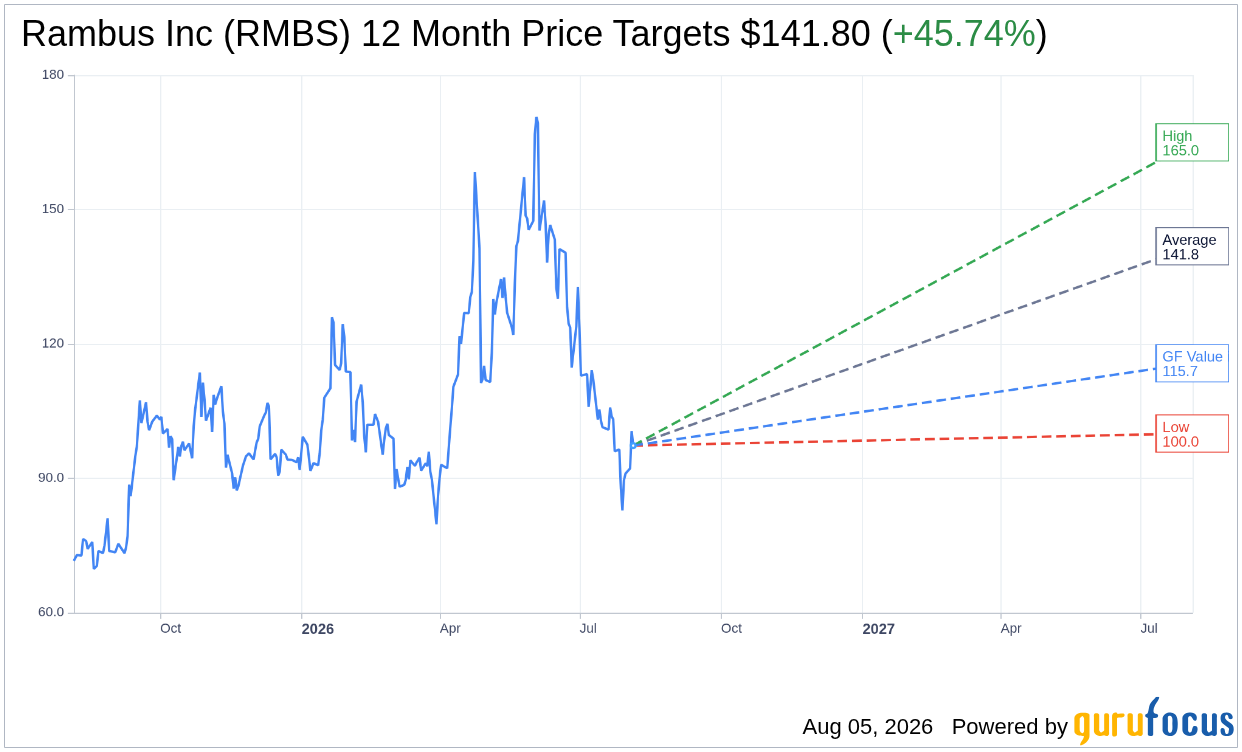
On August 05, 2026, Rambus Inc RMBS shares fell 3.2% to $97.30. The stock has experienced significant volatility over the past year, trading between a 52-week high of $174.10 and a low of $67.15.
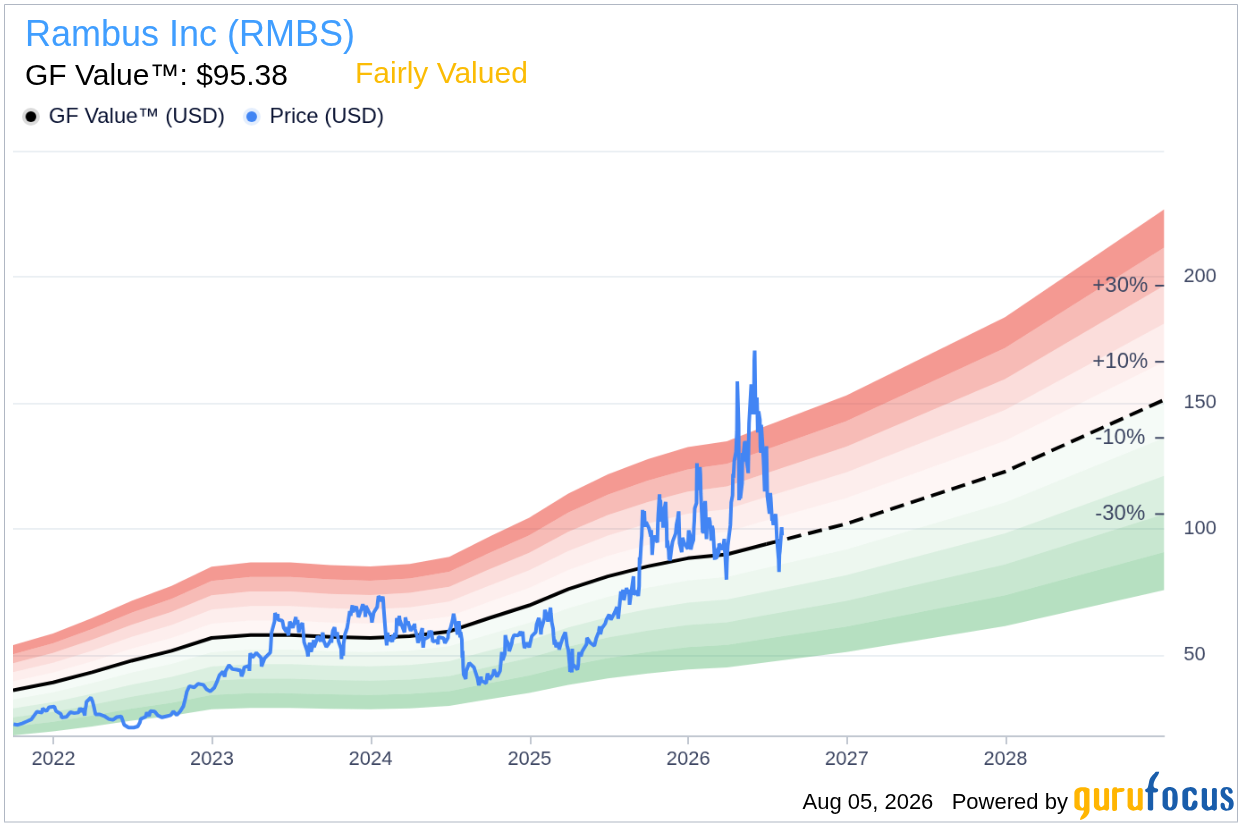
- GF Value™ verdict: RMBS is currently priced at $97.30, which is 2.0% above the GF Value™ estimate of $95.38.
- GF Score™: 90/100 (Strong), indicating robust fundamentals and overall performance.
- Notable signal: Insiders sold $11.3M in shares over the last three months, with no purchases reported.
Is RMBS Overvalued or Undervalued?
The current trading price of Rambus Inc is $97.30, which is slightly above the GF Value™ estimate of $95.38, indicating that the stock is approximately 2.0% overvalued. GF Value™ represents GuruFocus' proprietary intrinsic value estimate, calculated based on historical trading multiples, the company's past growth, and projections for future performance. This slight overvaluation suggests limited margin of safety for potential investors, highlighting a risk in entering or increasing positions in the current market environment.
With the GF Valuation marked as "Fairly Valued," it is essential to consider that while the stock is trading above its intrinsic value estimate, it has demonstrated strong growth metrics and a solid financial foundation. However, investors should be cautious about the potential for price corrections if market conditions change or if company performance does not meet expectations.
How Does RMBS's Valuation Compare to Its History?
| Metric | Current | Historical |
|---|---|---|
| P/E (TTM) | 44.6x | 34.4x |
| Forward P/E | 31.9x | N/A |
Rambus Inc's current P/E ratio of 44.6x is significantly above its 5-year median of 34.4x, indicating that the stock is trading at a premium compared to its historical valuation metrics. This elevated P/E ratio reinforces the GF Value™ assessment of overvaluation, suggesting that the stock may be priced for perfection, and any missteps could lead to a downward adjustment in price.
What Does RMBS's GF Score™ Tell Us?
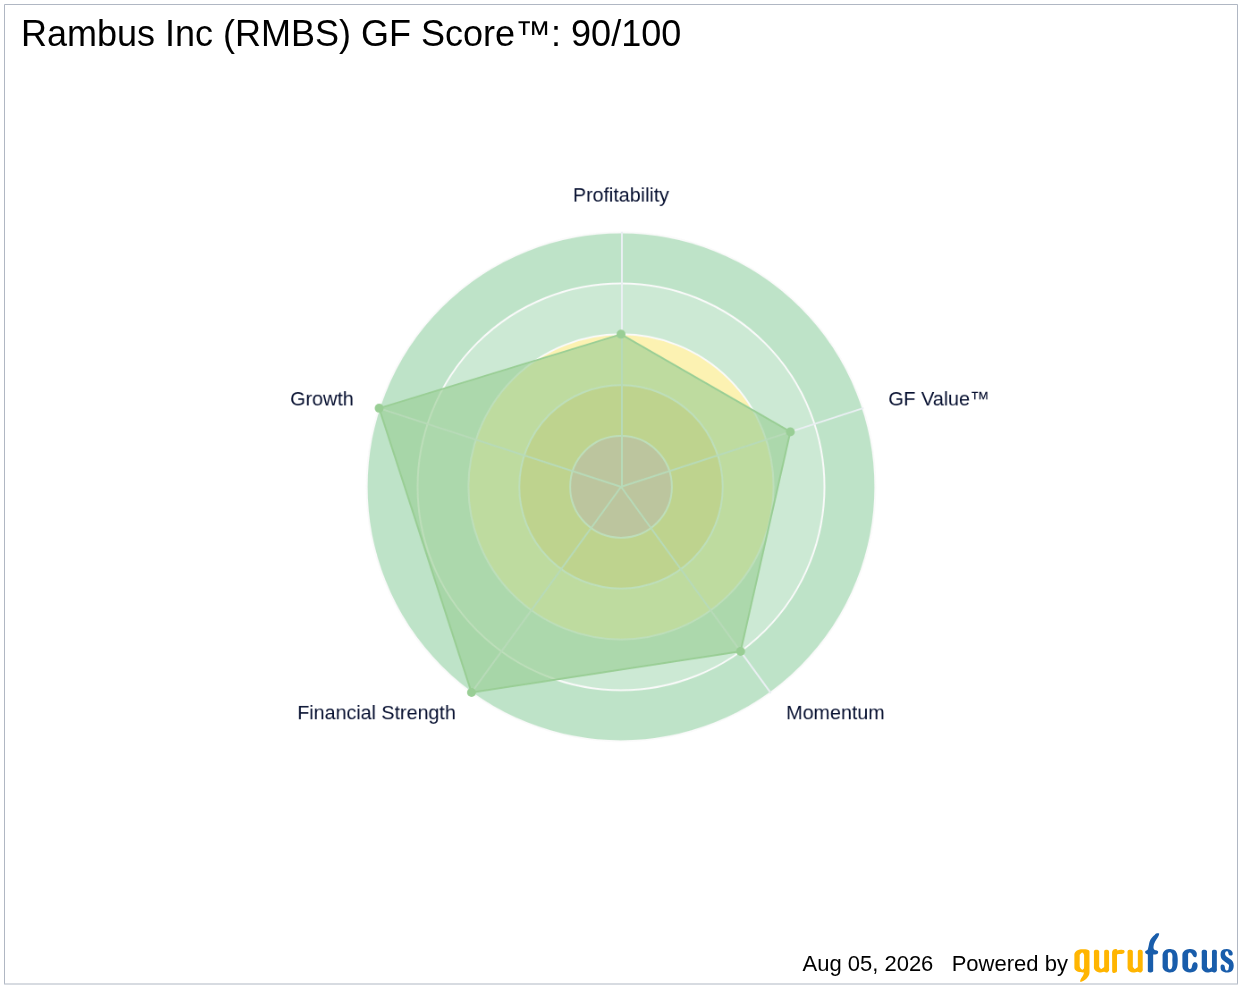
The GF Score™ is a comprehensive measure of a company's overall performance, considering financial strength, profitability, growth potential, valuation metrics, and momentum. Rambus Inc holds a strong GF Score™ of 90/100, with its highest sub-rank in growth (10/10) and its weakest in profitability (6/10).
| Metric | Rating |
|---|---|
| GF Score™ | 90 |
| Financial Strength | 10/10 |
| Profitability | 6/10 |
| Growth | 10/10 |
| Valuation | 7/10 |
| Momentum | 8/10 |
The high GF Score™ reflects Rambus Inc's robust financial position and growth potential, particularly in the competitive semiconductor industry. However, the profitability rank of 6/10 indicates that there may be challenges in sustaining high profit margins, which investors should monitor closely as they consider the stock's future performance.
What Are Gurus and Insiders Doing with RMBS?
Currently, 7 gurus hold shares of Rambus Inc, with 3 adding to their positions and 5 trimming their stakes in recent quarters. This mixed activity suggests a cautious sentiment among institutional investors, with some seeing value in the stock while others are reducing exposure.
Insider activity raises further concerns, as insiders have sold $11.3 million worth of shares in the last three months without any reported purchases. This trend may indicate a lack of confidence from those closest to the company's operations and could signal potential challenges ahead for the stock price. Investors often view insider selling as a red flag, particularly in the context of overall market performance.
What This Means for Investors
Based on the GF Value™ estimate, Rambus Inc RMBS is currently overvalued with a price of $97.30 compared to its GF Value™ of $95.38. With strong growth potential and financial strength, the stock offers a solid foundation, but the elevated P/E ratio and insider selling suggest caution. Investors should weigh these factors carefully when considering their positions.
For more detailed insights, you can visit the Rambus Inc RMBS stock page and explore additional valuation metrics on the GF Value™ page.
Frequently Asked Questions
What is RMBS's GF Score™?
RMBS has a GF Score™ of 90/100, indicating a strong overall performance based on various fundamental metrics.
Is RMBS overvalued or undervalued?
Based on the GF Value™ estimate, RMBS is currently overvalued, trading at 2.0% above its intrinsic value estimate.
What is RMBS's P/E ratio?
RMBS's P/E ratio is 44.6x, which is significantly higher than its 5-year median of 34.4x, indicating that the stock is trading at a premium compared to its historical valuation.
This stock alert was generated using automated technology and GuruFocus financial data to provide readers with timely and accurate market reporting. This content was reviewed by GuruFocus editorial team prior to publication. Please send any questions or comments about this story to [email protected].

