

On August 05, 2026, Xanadu Quantum Technologies Limited (ticker: XNDU) released its second-quarter financial results, revealing mixed performance metrics that underscore the company’s unique valuation profile and investor interest. Despite reporting a GAAP EPS loss narrower than expected and a revenue increase year-over-year, the stock’s valuation remains complex due to its unprofitable status and cash flow challenges.
- Xanadu’s current Price-to-Sales (P/S) ratio stands at an extraordinary 319.38x, significantly below its historical median of approximately 362.6x but still reflecting market expectations for substantial future growth; earnings-based valuation metrics like P/E are not applicable given ongoing losses.
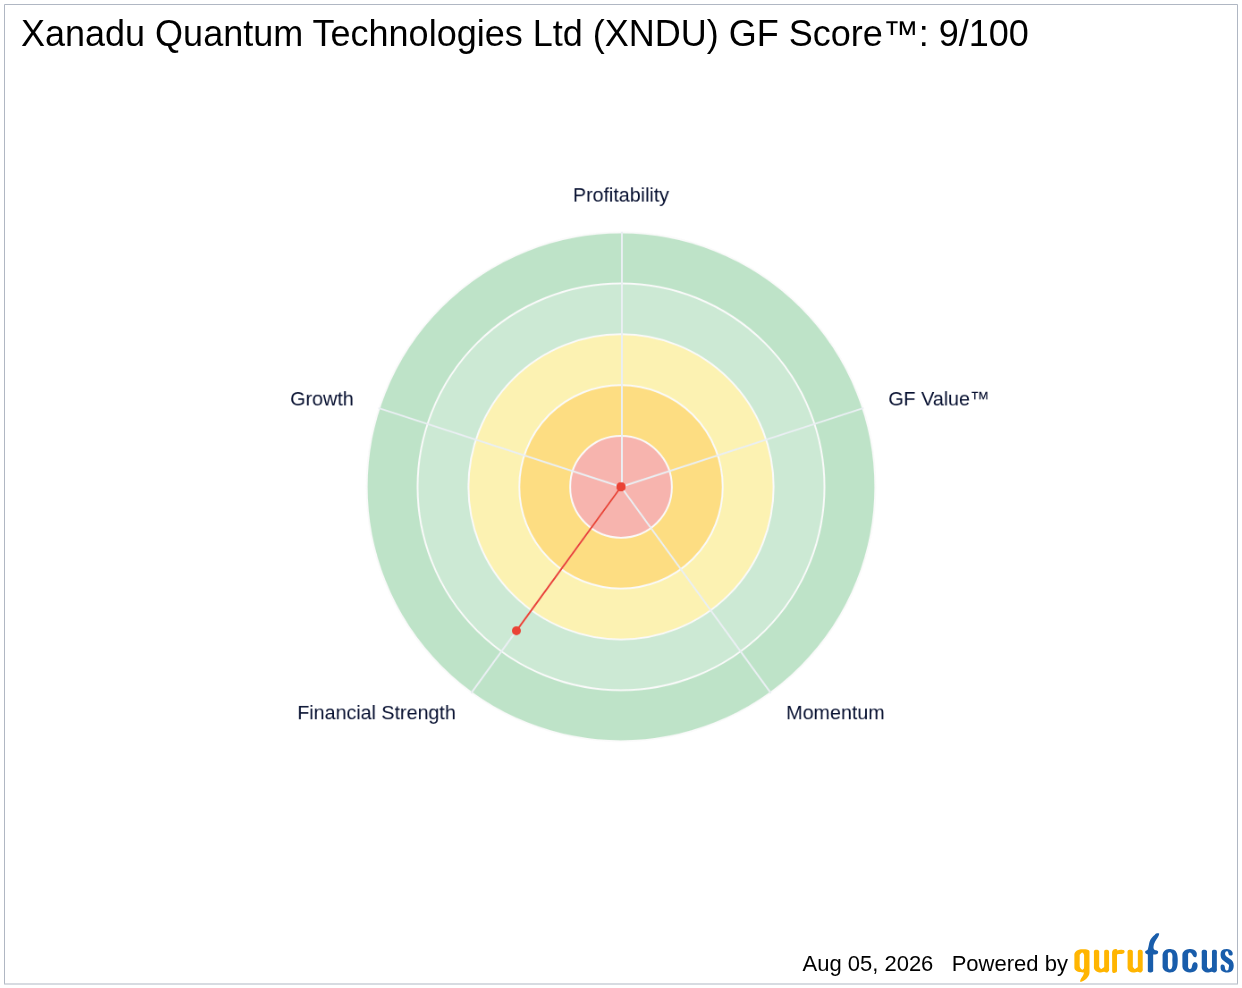
- The company’s GF Score™ is a low 9 out of 100, indicating considerable room for improvement in profitability and growth despite solid financial strength.
- Notably, two prominent gurus currently hold XNDU shares, with two adding positions and none trimming in recent quarters, signaling a strong moat signal from institutional smart money investors.
What's Behind the News?
Xanadu Quantum Technologies Limited announced its Q2 2026 earnings, reporting a GAAP EPS loss of -$0.14, which beat analyst expectations by $0.03. Revenue grew 42.5% year-over-year to $1.51 million but missed consensus estimates by $0.49 million. The mixed financial results were accompanied by the announcement of a potential $300 million at-the-market (ATM) equity offering program, which likely contributed to recent stock price gains. This capital raise initiative suggests Xanadu is positioning itself to fund ongoing research and development efforts in the quantum computing space.
Operating within the technology sector and software industry, Xanadu specializes in photonic quantum computing hardware and software platforms. Its product suite includes Aurora, PennyLane, Catalyst, and Lightning, targeting applications across automotive, aerospace, energy, materials, and semiconductor sectors. With a market capitalization of $3.44 billion, Xanadu is an emerging player in the nascent quantum computing industry, where growth potential is high but profitability remains elusive.
Is XNDU Overvalued on a Price-to-Sales Basis?
Xanadu’s current Price-to-Sales ratio of 319.38x, while slightly below its historical median of 362.61x, remains extraordinarily elevated compared to typical industry standards. This valuation implies that investors are pricing in significant future revenue growth and technological breakthroughs, reflecting optimism about the company’s long-term prospects in quantum computing. However, traditional earnings-based valuation metrics such as the Price-to-Earnings (P/E) ratio are not meaningful here, as Xanadu continues to operate at a net loss with a negative operating margin exceeding 1100%. The company’s negative cash flow and unprofitable status make P/E ratios irrelevant for valuation purposes at this stage.
GF Value™ for Xanadu is currently unavailable due to the lack of positive earnings and cash flow, serving as a directional caution rather than a precise valuation benchmark. Investors should interpret the lofty P/S ratio as a signal that the market is heavily discounting future growth potential rather than current financial performance. For more on GF Value™, visit GF Value™.
What Does XNDU's GF Score™ Tell Us?
The GF Score™ is a composite metric designed to evaluate a company’s overall financial health, profitability, growth, valuation, and momentum by aggregating multiple fundamental factors. Xanadu’s GF Score™ of 9 out of 100 indicates significant challenges, particularly in profitability and growth, despite relatively strong financial strength metrics.
| Metric | Rating |
|---|---|
| GF Score™ | 9/100 |
| Financial Strength | 7/10 |
Xanadu’s strongest area is financial strength, supported by a robust current ratio of 14.35 and a low debt-to-equity ratio of 0.15, indicating ample liquidity and manageable leverage. However, profitability metrics such as return on equity (-58.15%) and operating margin (-1129.28%) are deeply negative, reflecting ongoing investment in R&D and the early-stage nature of the business. Growth metrics remain flat, consistent with the company’s nascent revenue base and unprofitable operations. Investors should weigh these strengths and weaknesses carefully when assessing Xanadu’s risk profile. For detailed metrics, visit the XNDU stock page.
What Are Gurus and Insiders Doing with XNDU?
One of the most notable signals for Xanadu is its strong guru ownership profile. According to GuruFocus data, two premium gurus currently hold XNDU shares, with two adding to their positions and none trimming in recent quarters. This positive net addition by sophisticated institutional investors suggests confidence in Xanadu’s long-term potential despite short-term financial challenges. Insider trading activity is minimal, with no reported insider purchases or sales in the recent or past 12 months, indicating no significant insider-driven sentiment shifts.
What This Means for Investors
Xanadu Quantum Technologies represents a classic case of a high-growth, unprofitable technology company where traditional valuation metrics like P/E ratios do not apply. The market’s willingness to pay a premium Price-to-Sales multiple well above 300x reflects expectations of transformative growth in quantum computing technologies. However, the company’s low GF Score™ and negative profitability metrics highlight the risks inherent in early-stage ventures. The strong guru ownership and recent additions provide a valuable signal of institutional conviction, which may offer some reassurance to investors willing to tolerate volatility and uncertainty. For those interested in tracking Xanadu’s evolving story, the XNDU stock page offers comprehensive updates and analysis.
Frequently Asked Questions
What is XNDU's GF Score™?
XNDU’s GF Score™ is 9 out of 100, indicating weak overall financial health primarily due to poor profitability and stagnant growth, despite solid financial strength.
Is XNDU overvalued or undervalued?
Based on its Price-to-Sales ratio of 319.38x, which is slightly below its historical median but still extremely high, XNDU appears overvalued by traditional standards. However, earnings-based valuation metrics like P/E are not meaningful for this loss-making company.
What is XNDU's P/E ratio compared to historical?
XNDU does not have a meaningful P/E ratio due to ongoing losses. Instead, its financial strength, reflected by a strong Altman Z-Score and liquidity ratios, provides better insight into its financial stability.
This stock alert was generated using automated technology and GuruFocus financial data to provide readers with timely and accurate market reporting. This content was reviewed by GuruFocus editorial team prior to publication. Please send any questions or comments about this story to [email protected].

