


On August 06, 2026, Eli Lilly LLY reported impressive second-quarter results, significantly exceeding market expectations, driven by robust demand for its GLP-1 weight-loss medications.
- GF Value™ verdict: Eli Lilly is currently trading at $1,169.86, which is 19.0% undervalued compared to its GF Value™ of $1,444.91.
- GF Score™: 96/100, indicating a strong overall performance in key financial metrics.
- Insider activity shows no buying in the last three months, with insiders selling $18.6 million worth of shares.
What's Behind the News?
The recent earnings report from Eli Lilly showcased a remarkable year-over-year revenue surge of 48%, reaching $22.97 billion, which significantly surpassed Wall Street's forecast of $20.69 billion. The company's net profit also saw a substantial increase, climbing to $7.1 billion, or $7.94 per share, compared to $5.66 billion ($6.29 per share) in the same quarter last year. This growth was primarily driven by the strong sales of its GLP-1 drugs, particularly Mounjaro and Zepbound, which together generated nearly $15 billion in revenue.
Eli Lilly operates within the healthcare sector, specifically in the drug manufacturing industry, with a market capitalization of approximately $1.04 trillion. The company is known for its focus on neuroscience, cardiometabolic conditions, cancer, and immunology, producing key products such as Mounjaro for type 2 diabetes and Zepbound for obesity management. The recent partnership with CVS Health to enhance weight management programs further underscores the company's commitment to expanding its market reach.
Is LLY Overvalued or Undervalued?
The GF Value™ analysis indicates that Eli Lilly is currently modestly undervalued, with a GF Value™ of $1,444.91 compared to its current price of $1,169.86, representing a 19.0% margin of safety for investors. This valuation suggests that the stock has potential for appreciation based on its intrinsic value. Additionally, Eli Lilly's trailing P/E ratio stands at 53.52x, which is slightly above its 5-year median P/E of 53.38x, indicating that the stock is trading at a premium relative to its historical valuation. For more details, visit the GF Value™ page.
What Does LLY's GF Score™ Tell Us?
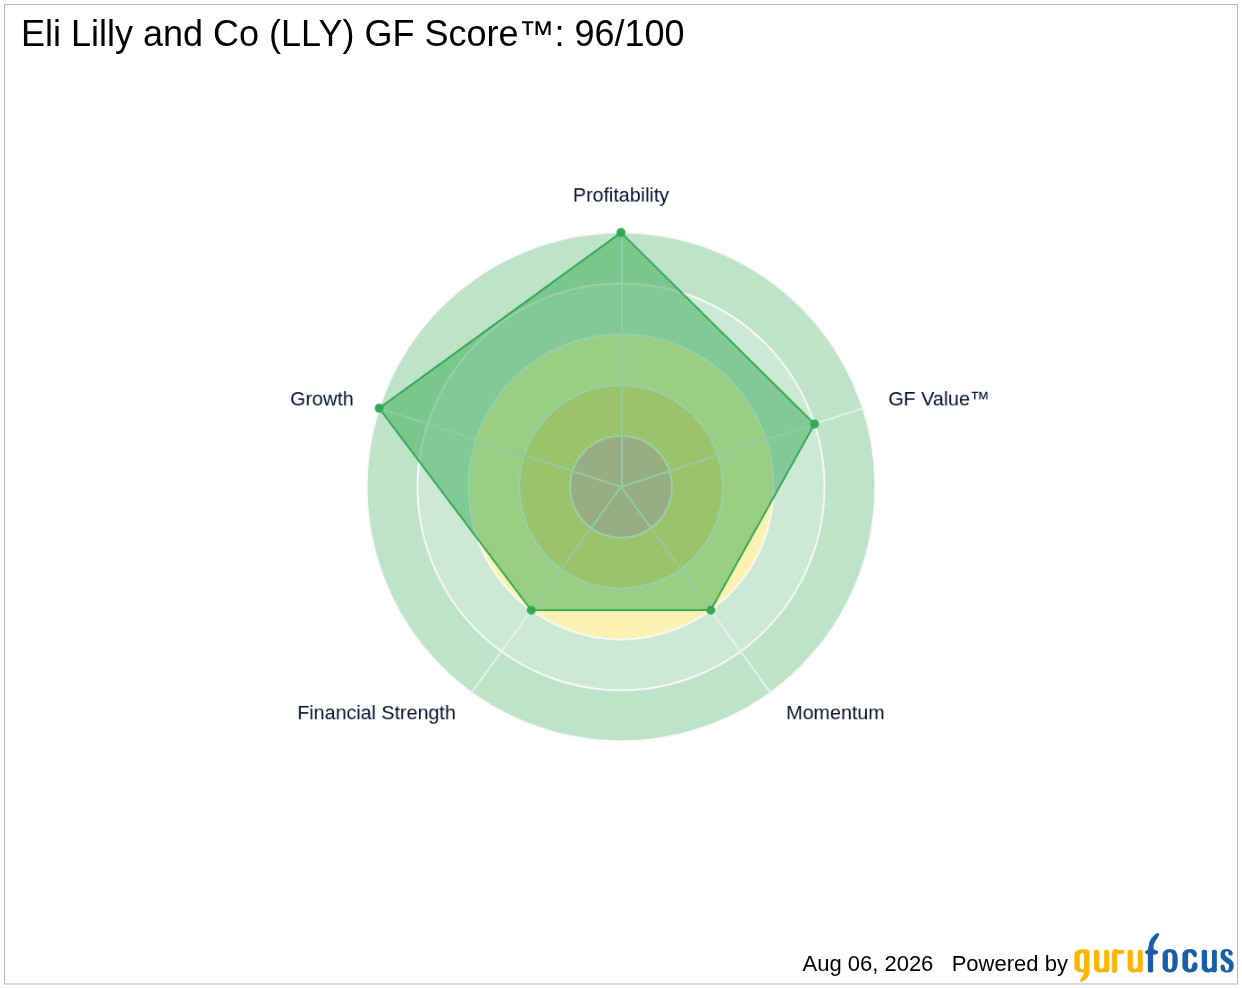
The GF Score™ is a comprehensive measure that evaluates a company's financial strength, profitability, growth potential, valuation, and momentum. Eli Lilly's GF Score™ of 96/100 reflects its strong performance across several key metrics, particularly in profitability and growth, where it ranks 10/10. However, the company has a momentum rank of 6/10, indicating some volatility in its stock performance.
| Metric | Rating |
|---|---|
| GF Score™ | 96 |
| Financial Strength | 6/10 |
| Profitability | 10/10 |
| Growth | 10/10 |
| Valuation | 8/10 |
| Momentum | 6/10 |
Overall, Eli Lilly demonstrates strong profitability and growth potential, but its financial strength could be improved. The company's valuation rank of 8/10 suggests that it is reasonably priced compared to its peers. For further insights, visit the LLY stock page.
What Are Gurus and Insiders Doing with LLY?
Eli Lilly is held by 25 gurus, with 13 adding to their positions and 11 trimming their holdings in recent quarters. This indicates a generally positive sentiment among institutional investors. However, insider activity has shown a net selling trend, with insiders selling $18.6 million worth of shares over the past three months, which may raise some concerns regarding insider confidence in the stock's future performance.
What This Means for Investors
In summary, Eli Lilly's strong Q2 results and robust demand for its GLP-1 medications position the company favorably in the market. With a GF Value™ indicating it is modestly undervalued and a high GF Score™, investors may find Eli Lilly an attractive option, despite the recent insider selling. For more detailed analysis, check out the LLY stock page.
Frequently Asked Questions
What is LLY's GF Score™?
LLY's GF Score™ is 96/100, indicating a strong overall performance in key financial metrics.
Is LLY overvalued or undervalued?
LLY is currently undervalued, trading at $1,169.86, which is 19.0% below its GF Value™ of $1,444.91.
What is LLY's P/E ratio compared to historical?
LLY's trailing P/E ratio is 53.52x, which is slightly above its 5-year median P/E of 53.38x, indicating it is trading at a premium compared to its historical valuation.
This stock alert was generated using automated technology and GuruFocus financial data to provide readers with timely and accurate market reporting. This content was reviewed by GuruFocus editorial team prior to publication. Please send any questions or comments about this story to [email protected].

