


On August 06, 2026, TransMedics Group Inc TMDX shares rose 4.9%, bringing the current price to $80.21. The stock has fluctuated within a 52-week range of $60.11 to $156.00, indicating significant volatility over the past year.
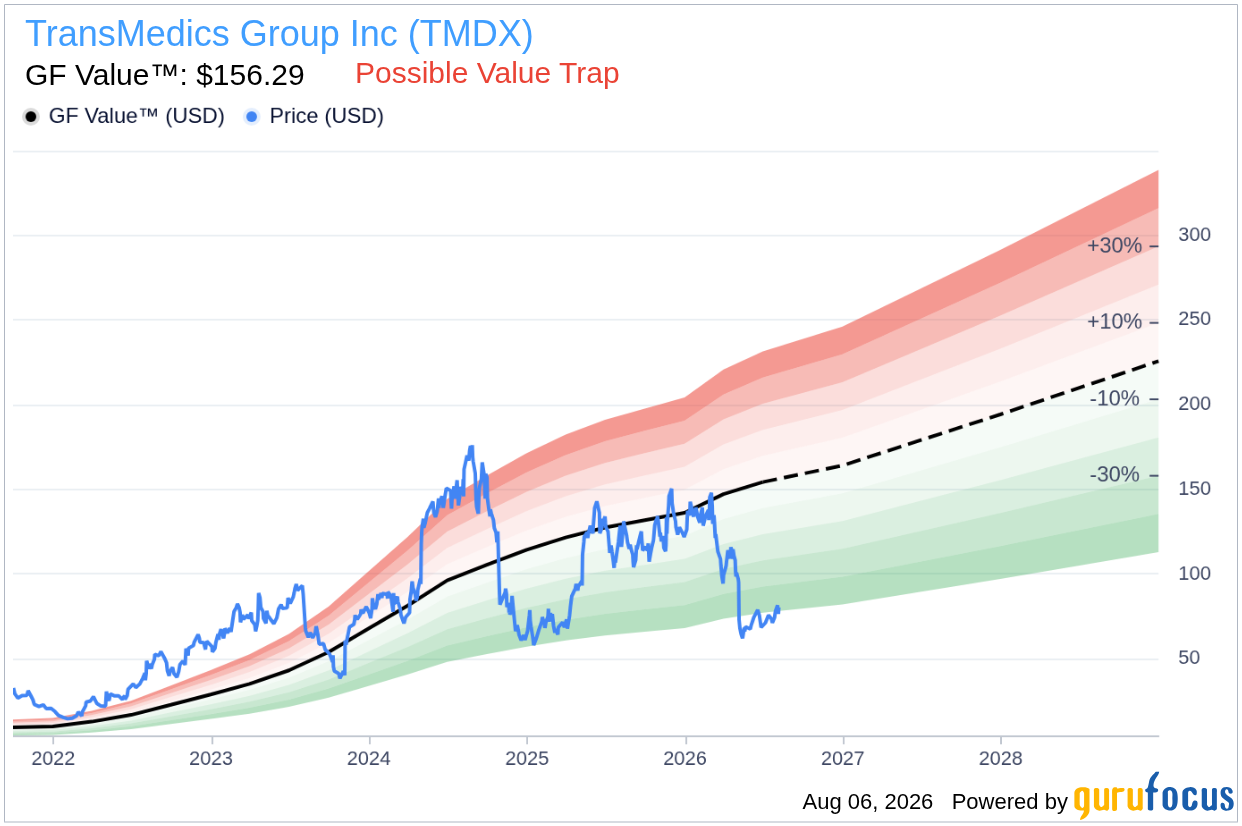
- GF Value™ verdict: Currently priced at $80.21, TMDX is estimated to be 48.7% undervalued compared to its GF Value™ of $156.29.
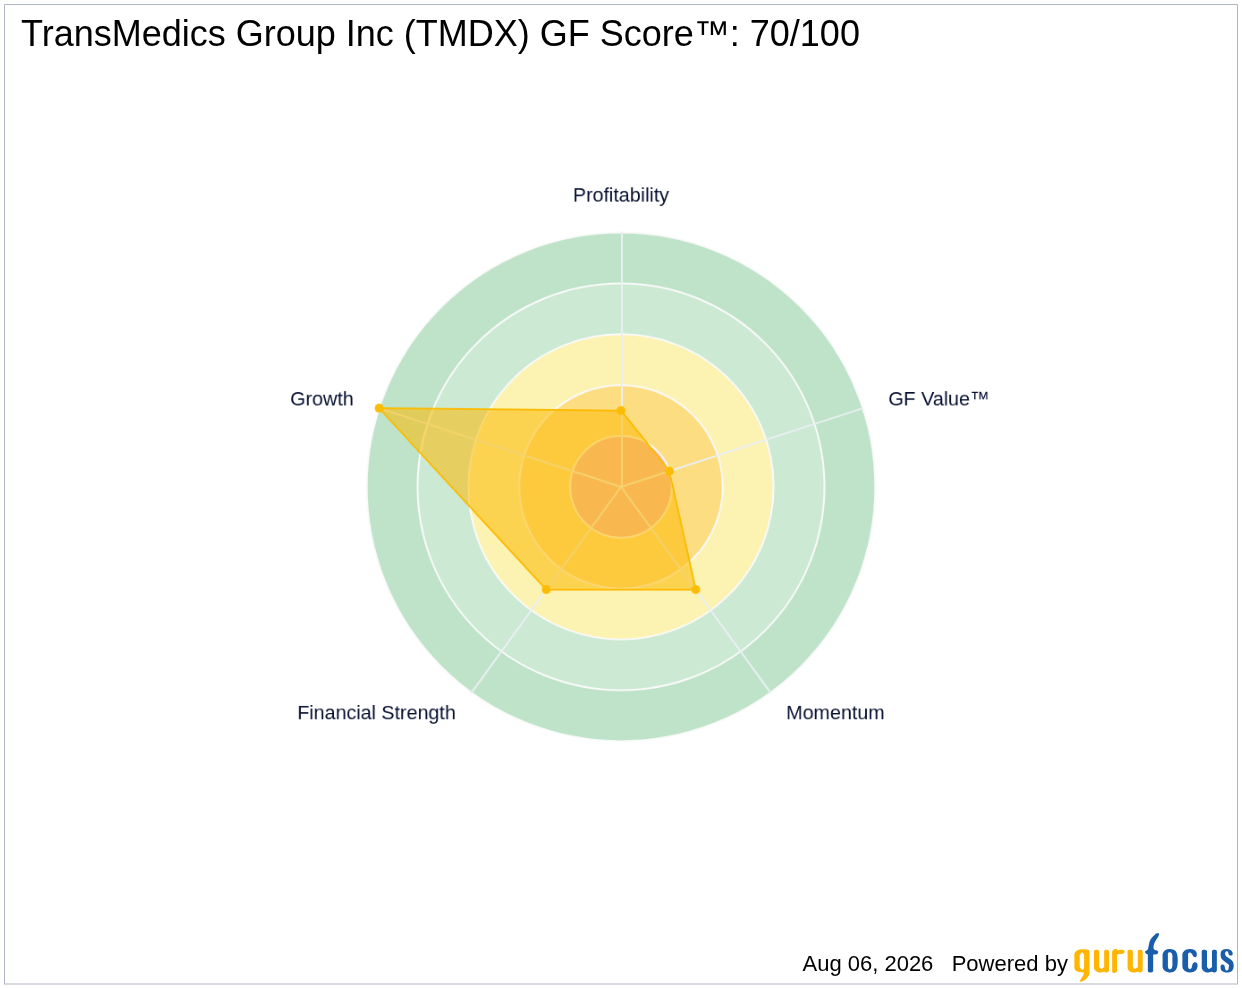
- GF Score™: TMDX holds a score of 70/100, indicating an above-average performance in several key metrics.
- Most notable signal: Insiders sold $0.7 million worth of shares in the last three months, signaling potential concerns from company leadership.
Is TMDX Overvalued or Undervalued?
TransMedics Group Inc TMDX is currently priced at $80.21, which is significantly below its GF Value™ of $156.29. This suggests that the stock is undervalued by approximately 48.7%, providing a potential margin of safety for investors looking at intrinsic value. The GF Value™ is GuruFocus' proprietary estimate of a stock's intrinsic value, based on historical trading multiples, past business growth, and expected future performance. However, the GF Valuation label indicates that TMDX is a possible value trap, prompting investors to think twice before making decisions.
While the significant gap between the current price and GF Value™ indicates a potential buying opportunity, the warning about a value trap should be taken into consideration. This could imply that while the stock appears undervalued based on historical valuations, there may be underlying issues affecting its future performance that investors need to consider.
How Does TMDX's Valuation Compare to Its History?
| Metric | Current | Historical |
|---|---|---|
| P/E (TTM) | 20.6x | 59.5x |
| Forward P/E | 43.2x | N/A |
TMDX's current P/E (TTM) ratio of 20.6x is significantly below its 5-year median P/E of 59.5x, indicating that the stock is trading well under its historical valuation levels. The forward P/E of 43.2x also suggests expectations for future earnings growth but remains higher than the current P/E. This analysis aligns with the GF Value™ verdict that TMDX is undervalued, as the P/E ratios reflect a company that may be trading at a discount compared to its historical performance.
What Does TMDX's GF Score™ Tell Us?
The GF Score™ measures a company's performance across various critical factors that can indicate its potential for growth and stability. TMDX's GF Score™ of 70/100 is indicative of above-average performance, with the strongest rank in growth and the weakest in valuation.
| Metric | Rating |
|---|---|
| GF Score™ | 70 |
| Financial Strength | 5/10 |
| Profitability | 3/10 |
| Growth | 10/10 |
| Valuation | 2/10 |
| Momentum | 5/10 |
The score reveals that TMDX excels in growth potential, with a top score of 10/10 in that category, indicating strong prospects for future earnings. However, the valuation rank of 2/10 suggests that the stock may not be favorably priced at this time, reinforcing the notion that it could be a potential value trap. Overall, the combination of a high growth score and a low valuation score presents mixed signals for investors.
What Are Gurus and Insiders Doing with TMDX?
Currently, four gurus hold shares of TMDX, with two increasing their positions while four have trimmed their holdings in recent quarters. This mixed sentiment indicates a cautious approach among experienced investors. Additionally, insiders have sold $0.7 million worth of shares in the last three months without any buying activity, which may reflect internal concerns about the company's prospects or valuation.
This pattern of insider selling could be a red flag for potential investors, as it suggests that those closest to the company may not be confident in its near-term performance. The guru ownership flow, along with insider activity, provides valuable insights into market sentiment and the stock's perceived value among seasoned investors.
What This Means for Investors
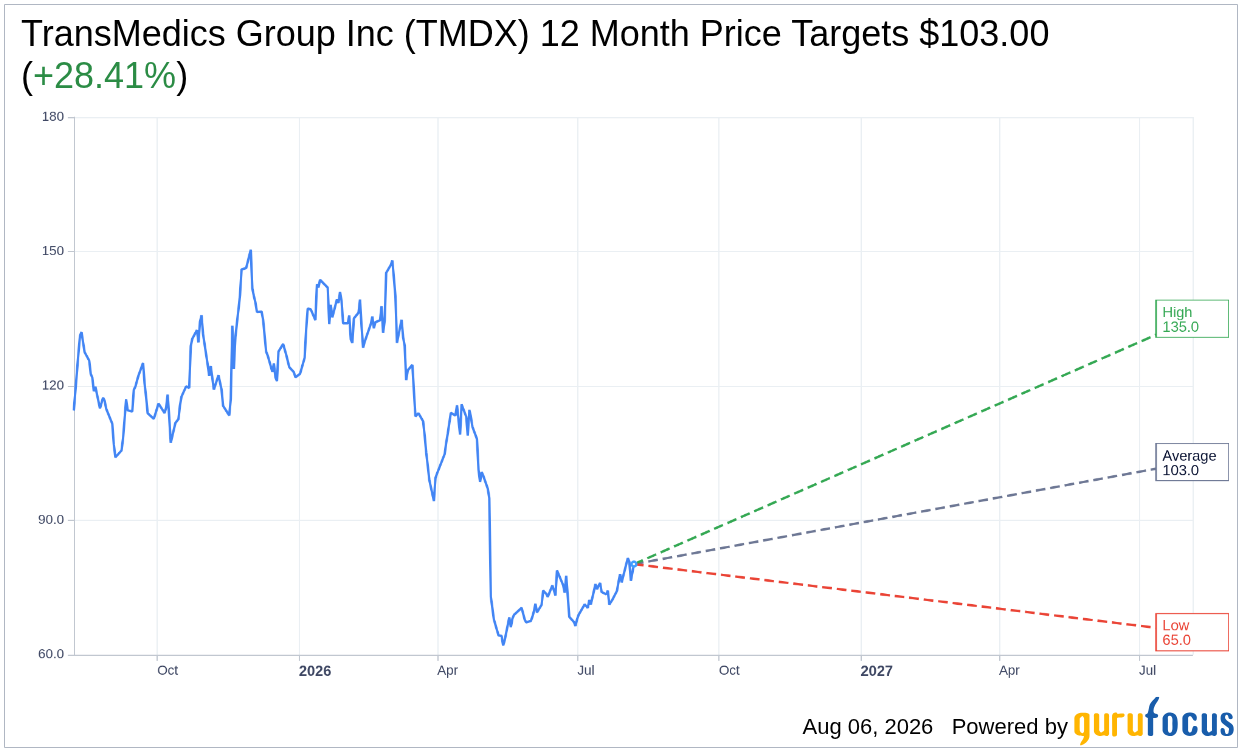
Based on the analysis of the GF Value™, TMDX appears to be undervalued at its current price of $80.21, which is significantly lower than the GF Value™ of $156.29. However, caution is advised due to the potential value trap warning and the insider selling activity, which may indicate underlying issues. Prospective investors should weigh these factors carefully before making decisions.
For more detailed financial data and analysis, visit the TransMedics Group Inc TMDX stock page.
Frequently Asked Questions
What is TMDX's GF Score™?
TMDX's GF Score™ is 70/100, indicating above-average performance compared to its peers across various metrics.
Is TMDX overvalued or undervalued?
TMDX is currently undervalued as its price of $80.21 is significantly below the GF Value™ of $156.29, suggesting potential for price appreciation.
What is TMDX's P/E ratio?
The current P/E (TTM) ratio for TMDX is 20.6x, which is 65% below its 5-year median P/E of 59.5x, indicating that the stock is trading at a much lower valuation than its historical average.
This stock alert was generated using automated technology and GuruFocus financial data to provide readers with timely and accurate market reporting. This content was reviewed by GuruFocus editorial team prior to publication. Please send any questions or comments about this story to [email protected].

