


On August 07, 2026, investor Michael Burry (Trades, Portfolio) disclosed new short positions against Oracle Corp (NYSE: ORCL) at $144.63 per share, citing concerns over rising leverage risks in the technology sector. This development follows Burry’s recent closure of a prior short involving January 2027 put options. Alongside Oracle, he also initiated a larger short on Nebius Group (NBIS), opting for direct equity shorts due to expensive put options. Despite these bearish moves, Burry remains optimistic about several of his other holdings.
- Oracle’s Price-to-Sales (P/S) ratio currently stands at 6.21x, modestly above its historical median of 5.4x, signaling the market’s expectation of sustained top-line growth; however, earnings-based valuation metrics like P/E are less meaningful given Oracle’s cash-flow challenges.
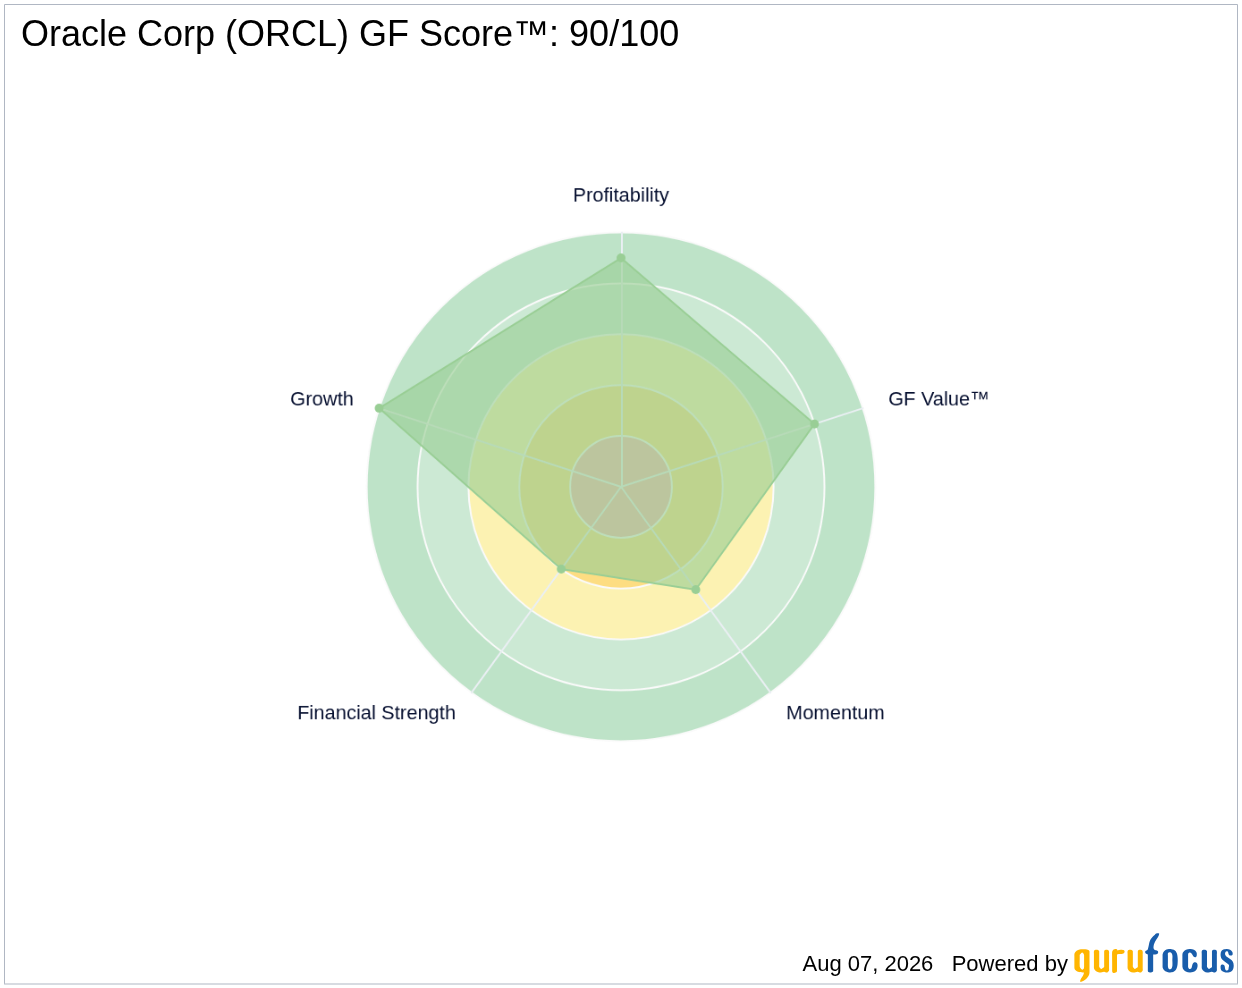
- Oracle boasts a robust GF Score™ of 90/100, reflecting strong profitability and growth fundamentals despite some financial strength concerns.
- Insider activity reveals no insider buying in the past three months, with insiders selling $63.7 million worth of shares, indicating cautious sentiment from those closest to the company.
What's Behind the News?
Michael Burry (Trades, Portfolio)’s recent short positions in Oracle highlight growing investor apprehension about leverage and financial risk within the technology sector. Burry, known for his contrarian bets, is signaling caution by shorting Oracle shares directly after closing out put options, suggesting a more aggressive stance on the company’s near-term prospects. His move also underscores concerns about valuation and capital structure risks amid a complex macroeconomic backdrop.
Oracle Corp is a major player in enterprise software and cloud infrastructure, providing a wide array of IT solutions including databases, middleware, and cloud platforms. Founded in 1977, Oracle has evolved into a technology giant with a market capitalization of $413.26 billion, operating primarily in the Technology sector under the Software industry classification. The company’s offerings are critical for large-scale transaction processing and increasingly for AI model training workloads, positioning it as a strategic vendor in enterprise IT.
Is ORCL Overvalued on a Price-to-Sales Basis?
Oracle’s current Price-to-Sales (P/S) ratio of 6.21x is slightly above its five-year median of 5.4x, indicating that the market is pricing in expectations for continued revenue growth and operational resilience. This premium suggests investors anticipate Oracle’s ability to sustain and possibly accelerate its top-line expansion, which has grown at an average rate of 8.6% over the past three years. However, Oracle’s earnings-based valuation metrics, such as the trailing twelve months (TTM) P/E ratio of 24.61x, are less informative due to the company’s negative free cash flow and cash-flow margin challenges, which complicate traditional earnings valuation models.
In this context, the GF Value™ of $189.55, which implies Oracle is approximately 24.3% undervalued relative to its current price of $143.47, should be interpreted cautiously. GF Value™ is a proprietary intrinsic value estimate that integrates historical trading multiples, past growth, and future performance expectations. For a company like Oracle, which faces profitability and cash flow headwinds, GF Value™ serves more as a directional signal rather than a precise fair-value target. Investors should consider this alongside other financial and market indicators. For more on GF Value™, see GF Value™.
What Does ORCL's GF Score™ Tell Us?
The GF Score™ is a composite metric that evaluates a company’s overall financial health by aggregating key dimensions such as profitability, growth, valuation, momentum, and financial strength. Oracle’s impressive GF Score™ of 90 out of 100 reflects a strong combination of profitability and growth, tempered by moderate financial strength and momentum ratings.
| Metric | Rating |
|---|---|
| GF Score™ | 90 |
| Financial Strength | 4/10 |
| Profitability | 9/10 |
| Growth | 10/10 |
| Valuation | 8/10 |
| Momentum | 5/10 |
Oracle’s strongest areas are its growth and profitability, with a top decile growth rank (10/10) and near-top profitability rank (9/10), reflecting solid operating margins and earnings expansion. However, the company’s financial strength score of 4/10 flags concerns such as a high debt-to-equity ratio of 3.67 and an Altman Z-Score of 1.69, which places it in the distress zone, indicating potential bankruptcy risk within two years if conditions deteriorate. Momentum is moderate, suggesting mixed recent price performance. For a detailed breakdown, visit the ORCL stock page.
What Are Gurus and Insiders Doing with ORCL?
Oracle currently enjoys significant institutional interest, with 20 premium gurus holding the stock. In recent quarters, 14 gurus have increased their positions while 10 have trimmed theirs, reflecting a nuanced but generally positive outlook among top investors. This guru 13F activity is a distinctive feature of GuruFocus data, providing insights unavailable from other platforms like Simply Wall St or Morningstar.
Conversely, insider activity over the past three months shows no insider purchases and insider selling totaling $63.7 million. This net selling by insiders may indicate caution or profit-taking at current price levels, adding a layer of complexity to the investment narrative.
What This Means for Investors
Oracle’s valuation on a Price-to-Sales basis suggests the market is pricing in continued revenue growth, yet its negative free cash flow and financial strength concerns temper enthusiasm. The GF Value™ indicates the stock is modestly undervalued, but this should be viewed as a directional signal rather than a precise valuation benchmark given Oracle’s cash flow challenges. The mixed signals from insider selling and guru ownership further underscore the need for investors to weigh growth prospects against leverage risks carefully. For a comprehensive view of Oracle’s financial and market data, visit the ORCL stock page or explore investment opportunities with the GuruFocus Stock Screener.
Frequently Asked Questions
What is ORCL's GF Score™?
ORCL’s GF Score™ of 90/100 reflects strong profitability and growth metrics, balanced against moderate financial strength and momentum. It is a comprehensive measure of the company’s overall financial health and investment quality.
Is ORCL overvalued or undervalued?
Based on Price-to-Sales, ORCL trades modestly above its historical median, implying expectations of sustained growth. Earnings-based valuation metrics like P/E are less meaningful due to Oracle’s negative free cash flow and cash-flow margin issues.
What is ORCL's P/E ratio compared to historical?
Oracle’s trailing twelve months P/E ratio is 24.61x, below its five-year median of 32.3x. However, given the company’s cash-flow negativity, P/E is not the most reliable valuation metric for ORCL’s current financial profile.
This stock alert was generated using automated technology and GuruFocus financial data to provide readers with timely and accurate market reporting. This content was reviewed by GuruFocus editorial team prior to publication. Please send any questions or comments about this story to [email protected].

