

On August 07, 2026, the Invesco QQQ Trust (ticker: QQQ) is navigating critical technical pivot points that may influence its near-term price trajectory. The DeMark pivot calculation identifies a pivot high at $722.40 and a pivot low at $711.58, signaling potential bullish or bearish momentum depending on price action relative to these levels.
- GF Value™ verdict: QQQ is trading at $714.65, approximately 17.4% above its GF Value™ of $608.84, indicating overvaluation.
- GF Score™: 88/100, reflecting a strong overall fundamental quality.
- Financial signal: Guru 13F data shows 8 premium gurus currently hold QQQ, with 6 trimming positions and 3 adding in recent quarters, highlighting mixed institutional sentiment.
What's Behind the News?
The recent technical analysis of QQQ highlights key pivot points derived from the DeMark method, which traders often use to identify potential turning points in price trends. A break above the pivot high of $722.40 would typically be interpreted as a bullish signal, suggesting that upward momentum may continue. Conversely, a drop below the pivot low of $711.58 could indicate bearish sentiment, potentially leading to a downward trend. These pivot levels serve as important markers for investors and traders to gauge market sentiment and adjust their strategies accordingly.
QQQ, the Invesco QQQ Trust, is an exchange-traded fund (ETF) that tracks the Nasdaq-100 Index, which includes 100 of the largest non-financial companies listed on the Nasdaq Stock Market. With a market capitalization of $470.45 billion, QQQ is a major player in the ETF space, providing broad exposure to technology and growth-oriented sectors. Although it does not generate revenue or earnings itself, as an ETF, it reflects the aggregated performance of its underlying holdings. Its beta of 1.24 indicates a moderately higher volatility compared to the overall market.
Is QQQ Overvalued or Undervalued?
According to GuruFocus’ proprietary GF Value™ metric, QQQ is currently trading at $714.65, which is 17.4% above its intrinsic value estimate of $608.84. This suggests that the ETF is overvalued relative to its historical trading multiples, business growth, and future performance estimates. The margin of safety, a critical concept for value investors, is therefore negative, implying that the current price may not offer a sufficient cushion against downside risk if market conditions deteriorate.
Looking at valuation multiples, QQQ’s trailing twelve-month price-to-earnings (P/E) ratio stands at 27.84x. Unfortunately, there is no available 5-year median P/E for direct comparison, which limits a historical valuation context. The forward P/E ratio is not reported, further complicating forward-looking valuation assessments. Investors should therefore exercise caution and consider the GF Value™ alongside other fundamental and technical indicators when evaluating QQQ’s price level. For more details on GF Value™, visit GF Value™.
What Does QQQ's GF Score™ Tell Us?
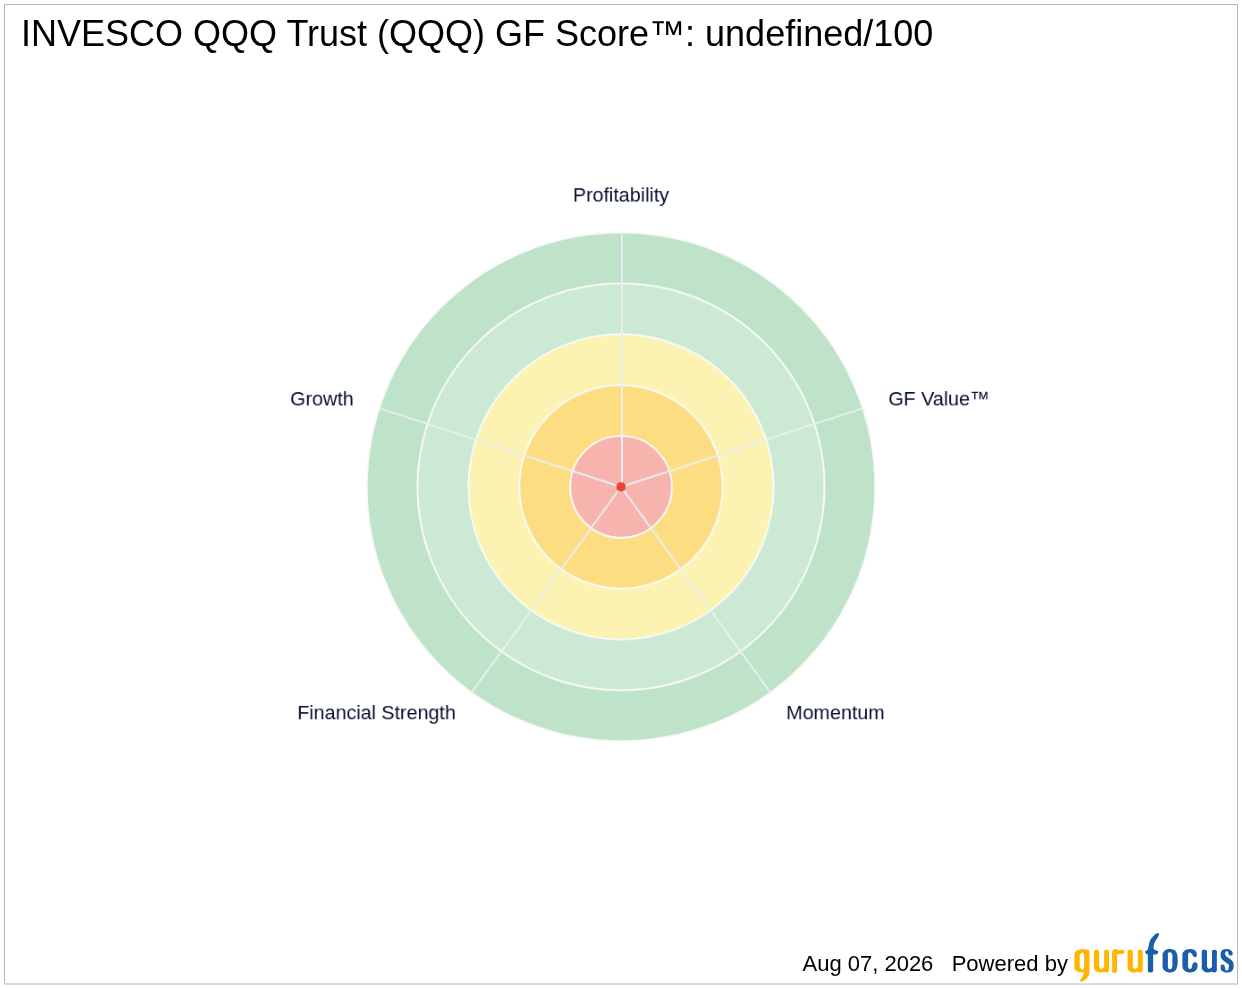
The GF Score™ is a composite measure that evaluates a stock’s overall quality by integrating financial strength, profitability, growth, valuation, and momentum factors. QQQ’s GF Score™ of 88 out of 100 reflects a robust fundamental profile, particularly in profitability and growth metrics. Below is a breakdown of QQQ’s key GF Score™ components:
| Metric | Rating |
|---|---|
| GF Score™ | 88 |
| Financial Strength | 7/10 |
| Profitability | 9/10 |
| Growth | 9/10 |
| Valuation | 6/10 |
| Momentum | 6/10 |
QQQ’s strongest sub-ranks lie in profitability and growth, scoring 9 out of 10 in each category. This aligns with the ETF’s underlying holdings, which generally exhibit strong operating margins (29.52%), net margins (13.92%), and impressive earnings growth over the past 1, 3, and 5 years (40.87%, 33.17%, and 26.13%, respectively). Financial strength is solid at 7/10, supported by healthy liquidity ratios and moderate debt levels. However, valuation and momentum ranks are more moderate, reflecting the premium price investors currently pay and the mixed signals from recent price movements. For more on QQQ’s fundamentals, see the QQQ stock page.
What Are Gurus and Insiders Doing with QQQ?
Institutional investor activity provides an important lens on market sentiment. GuruFocus tracks premium guru 13F filings and reports that 8 gurus currently hold QQQ. In recent quarters, 6 gurus have trimmed their positions while 3 have added, indicating a cautious stance among top investors. This mixed activity suggests some profit-taking or risk management amid the ETF’s overvaluation, balanced by continued interest from a subset of gurus who see value or growth potential. Insider activity is absent, with no reported insider buying or selling in the past 3 or 12 months, which is typical for an ETF structure that does not have traditional corporate insiders.
What This Means for Investors
The GF Value™ analysis signals that QQQ is trading above its intrinsic value by roughly 17.4%, suggesting limited margin of safety for new investors at current prices. While the ETF boasts a high GF Score™ driven by strong profitability and growth metrics, its valuation rank and mixed guru ownership trends counsel caution. The technical pivot points near $722 and $711 further highlight a critical juncture where price action could confirm either sustained bullish momentum or a reversal. Investors should weigh these valuation concerns against QQQ’s role as a diversified growth-oriented ETF with a substantial market cap of $470.45 billion. For those seeking deeper insight into QQQ’s fundamentals and price dynamics, visit the QQQ stock page or explore investment ideas via the GuruFocus Stock Screener.
Frequently Asked Questions
What is QQQ's GF Score™?
QQQ’s GF Score™ is 88 out of 100, indicating a strong overall fundamental quality, particularly in profitability and growth, balanced by moderate valuation and momentum scores.
Is QQQ overvalued or undervalued?
Based on GF Value™, QQQ is approximately 17.4% overvalued, trading at $714.65 versus an intrinsic value estimate of $608.84.
What is QQQ's P/E ratio compared to historical?
QQQ’s trailing twelve-month P/E ratio is 27.84x. However, there is no available 5-year median P/E for comparison, limiting historical valuation context.
This stock alert was generated using automated technology and GuruFocus financial data to provide readers with timely and accurate market reporting. This content was reviewed by GuruFocus editorial team prior to publication. Please send any questions or comments about this story to [email protected].

