


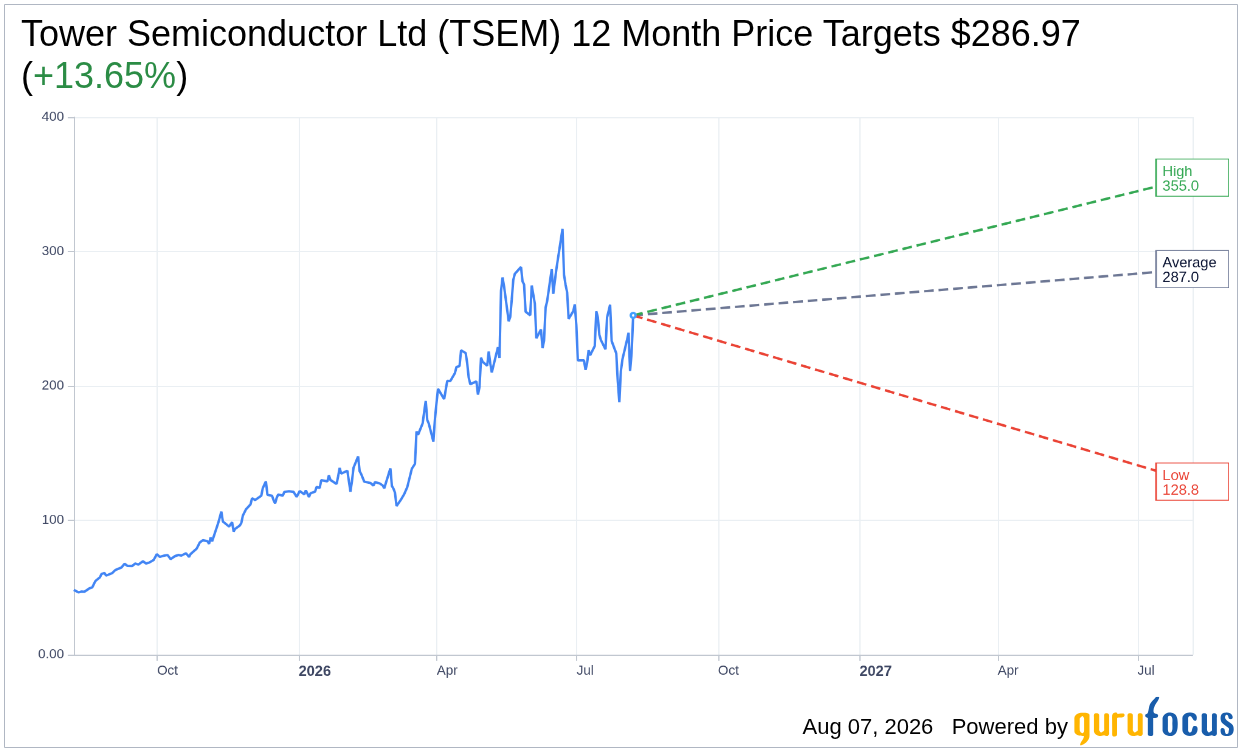
On August 07, 2026, Tower Semiconductor Ltd TSEM shares rose 12.3%, bringing the current price to $252.49. The stock has seen impressive price performance with a 52-week range stretching from $45.51 to $319.94.
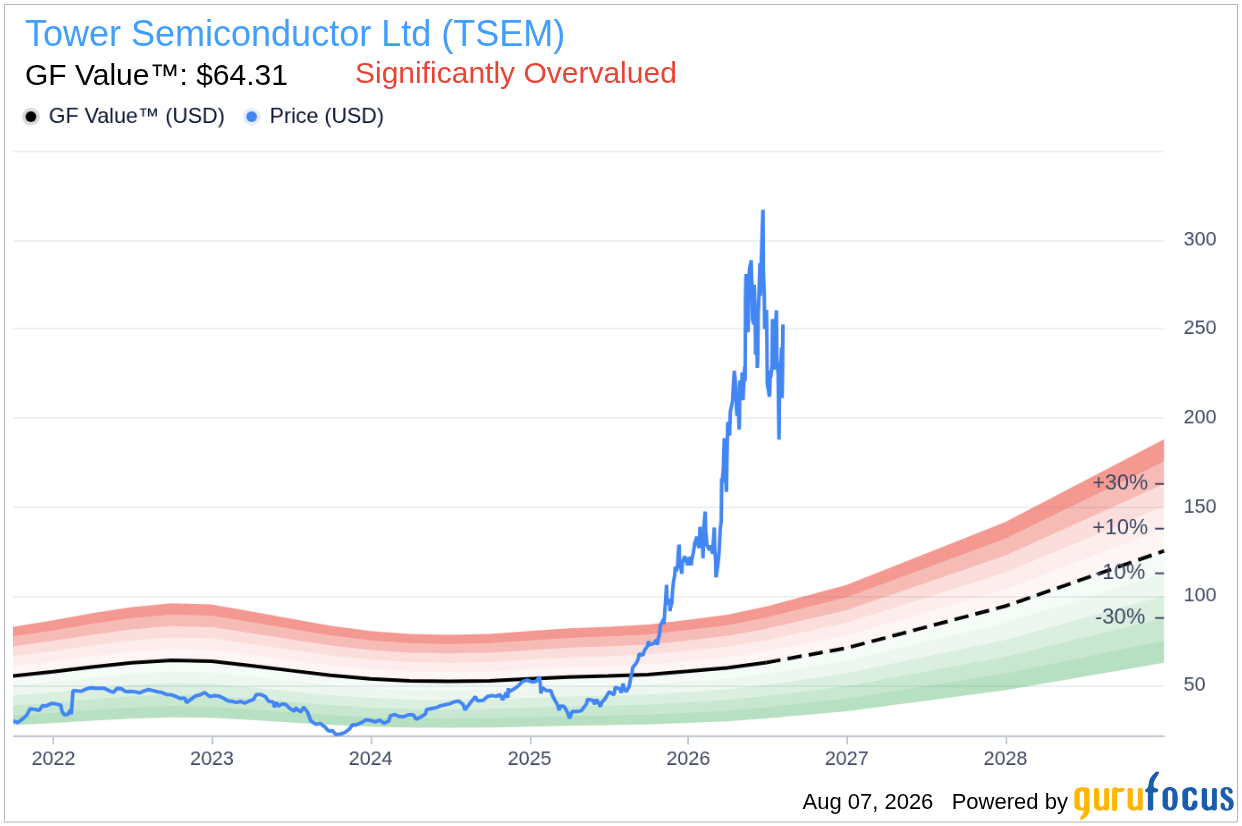
- GF Value™ verdict: The current price is $252.49, which is 292.6% above the GF Value™ estimate of $64.31, indicating significant overvaluation.
- GF Score™: TSEM scores 71/100, which is considered above average, reflecting a solid overall company profile.
- Notable signal: Insider activity shows that insiders sold $14.4M worth of shares in the last three months, with no purchases, suggesting a cautious outlook from those closest to the company.
Is TSEM Overvalued or Undervalued?
The comparison of Tower Semiconductor Ltd's current price to its GF Value™ suggests a significant overvaluation. The GF Value™ estimate, which is derived from historical trading multiples, past business growth, and future performance expectations, stands at $64.31. This indicates that the stock is currently trading at 292.6% above its intrinsic value, which poses a considerable risk for potential investors. A significant margin of safety is absent, as the current price does not provide a buffer for downside risk.
Given the GF Valuation label of "Significantly Overvalued," investors should be cautious when considering an investment in TSEM. The high premium of the current stock price over the GF Value™ suggests that the market may be overly optimistic about the company's future prospects, which could lead to a price correction if performance does not meet expectations.
How Does TSEM's Valuation Compare to Its History?
| Metric | Current | Historical |
|---|---|---|
| P/E (TTM) | 99.8x | 27.9x |
| Forward P/E | 72.4x | N/A |
Currently, TSEM's P/E (TTM) is 99.8x, which is 258% above its 5-year median P/E of 27.9x. This stark contrast indicates that the stock is trading at a significantly higher valuation compared to its historical performance. The forward P/E of 72.4x also suggests a premium that aligns with the GF Value™ verdict indicating overvaluation. Thus, the P/E analysis reinforces the notion that TSEM is currently overvalued.
What Does TSEM's GF Score™ Tell Us?
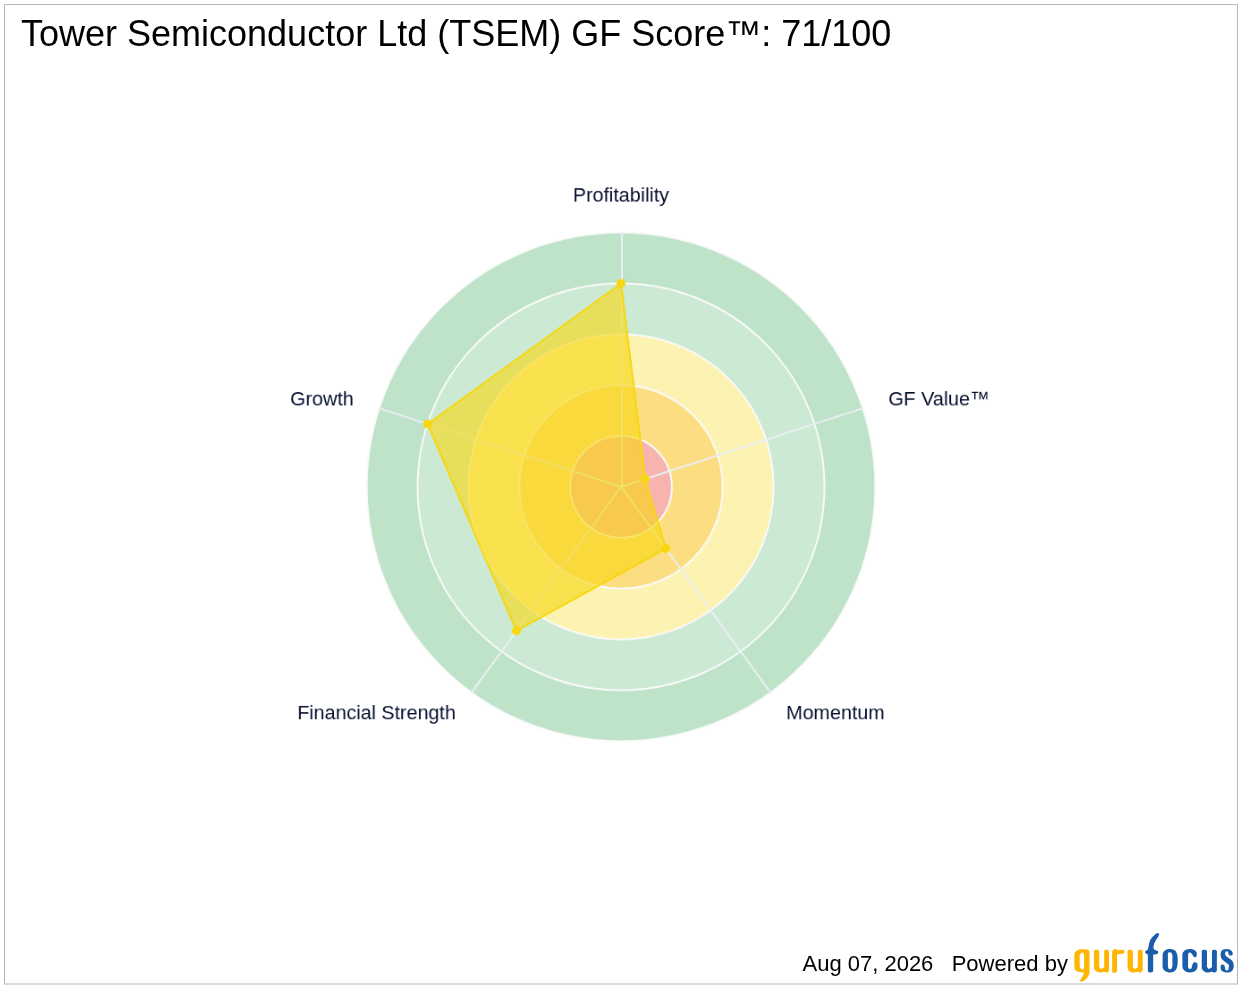
The GF Score™ evaluates a company's financial strength, profitability, growth prospects, valuation metrics, and momentum. TSEM's GF Score™ of 71/100 illustrates that it has an above-average overall profile, but there are significant variances in its sub-ranks.
| Metric | Rating |
|---|---|
| GF Score™ | 71 |
| Financial Strength | 7/10 |
| Profitability | 8/10 |
| Growth | 8/10 |
| Valuation | 1/10 |
| Momentum | 3/10 |
TSEM demonstrates strong profitability and growth ranks of 8/10, indicating robust operational performance and potential for future expansion. However, its valuation rank of 1/10 is concerning, highlighting the extreme overvaluation compared to historical standards. The momentum rank of 3/10 suggests a lack of sustained upward price movement, which could be indicative of potential volatility in the near term.
What Are Gurus and Insiders Doing with TSEM?
Currently, four gurus hold shares of Tower Semiconductor Ltd, with two adding to their positions and three trimming their holdings in recent quarters. This mixed activity suggests a divided sentiment among experienced investors regarding the stock's future.
In addition, insider selling totaling $14.4M in the last three months, with no insider purchases, raises concerns about the confidence level of those within the company. This selling pattern could be interpreted as insiders expecting a slowdown or correction, further reinforcing the notion of caution surrounding TSEM's current valuation.
What This Means for Investors
Based on the analysis, Tower Semiconductor Ltd TSEM appears to be significantly overvalued given its current price of $252.49 compared to the GF Value™ of $64.31. The lack of a margin of safety and the concerning insider selling signal caution for potential investors. For a deeper understanding of TSEM's financials and valuation metrics, you can visit the Tower Semiconductor Ltd (TSEM) stock page.
Frequently Asked Questions
What is TSEM's GF Score™?
TSEM has a GF Score™ of 71/100, indicating that the company has an above-average overall profile.
Is TSEM overvalued or undervalued?
TSEM is currently overvalued with a GF Value™ estimate of $64.31, showing a 292.6% premium over the current market price.
What is TSEM's P/E ratio?
TSEM has a P/E (TTM) of 99.8x, which is significantly higher than its 5-year median P/E of 27.9x, indicating extreme overvaluation.
This stock alert was generated using automated technology and GuruFocus financial data to provide readers with timely and accurate market reporting. This content was reviewed by GuruFocus editorial team prior to publication. Please send any questions or comments about this story to [email protected].

