


On August 07, 2026, Viavi Solutions Inc VIAV shares fell 3.6% to a current price of $39.16, marking a significant drop in the context of a 52-week range of $10.30 to $60.43. This recent decline adds to a volatile performance, with the stock having risen 119.6% year-to-date and an impressive 285.2% over the past year.
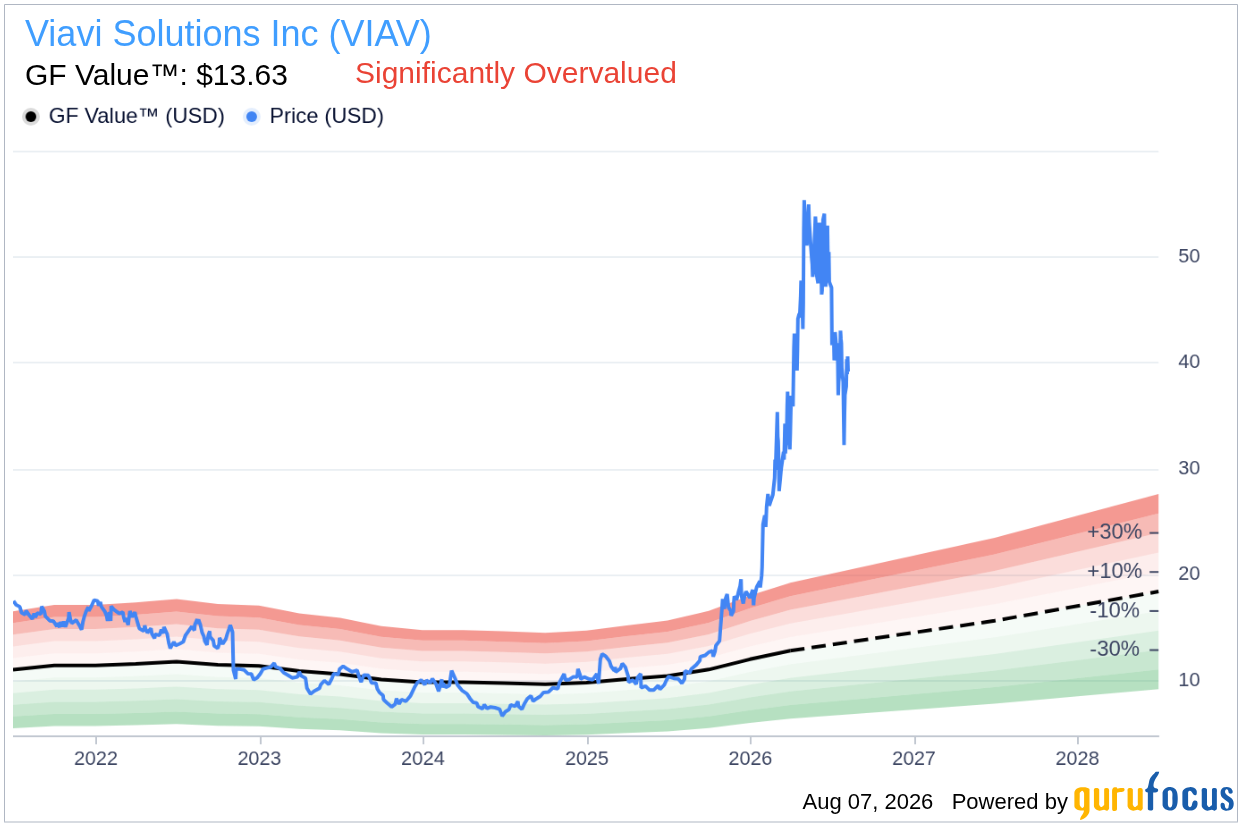
- GF Value™ verdict: Current price of $39.16 vs. GF Value of $13.63, indicating a 187.3% overvaluation.
- GF Score™: 45/100, signifying an average performance across various metrics.
- Most notable signal: Insiders sold $13.4M worth of shares in the last three months, with no buying activity.
Is VIAV Overvalued or Undervalued?
With the current share price of $39.16 significantly above the GF Value™ estimate of $13.63, Viavi Solutions appears to be overvalued. The GF Value™ is a proprietary intrinsic value estimate that considers historical trading multiples, past business growth, and future performance forecasts. This overvaluation suggests that the stock price may not be justified by the company's fundamentals, particularly given its status as a loss-making entity. The GF Valuation label categorizes VIAV as "Significantly Overvalued," raising concerns about potential risks for investors who might enter the market at current price levels.
Furthermore, the alarming margin of safety indicated by the difference between the current price and GF Value™ highlights the risks inherent in purchasing shares at inflated levels. As the company is cash-flow-negative, traditional earnings-based valuation metrics like Price-to-Earnings (P/E) ratios may not provide an accurate picture of its financial health, making it crucial for investors to consider alternative metrics such as Price-to-Sales (P/S).
How Does VIAV's Valuation Compare to Its History?
| Metric | Current | Historical |
|---|---|---|
| P/E (TTM) | N/A | 100.0x (5-Year Median) |
| Forward P/E | 30.5x | N/A |
Since Viavi Solutions is currently unprofitable, the traditional P/E ratio is not applicable, and the stock trades at a forward P/E of 30.5x. In comparison, the company's 5-year median P/E stands at an astonishing 100.0x. This stark difference indicates that, despite the forward P/E being lower than the historical average, the absence of profitability makes such comparisons less meaningful. Consequently, the P/E analysis aligns with the GF Value™ verdict, reinforcing the notion that VIAV is overvalued.
What Does VIAV's GF Score™ Tell Us?
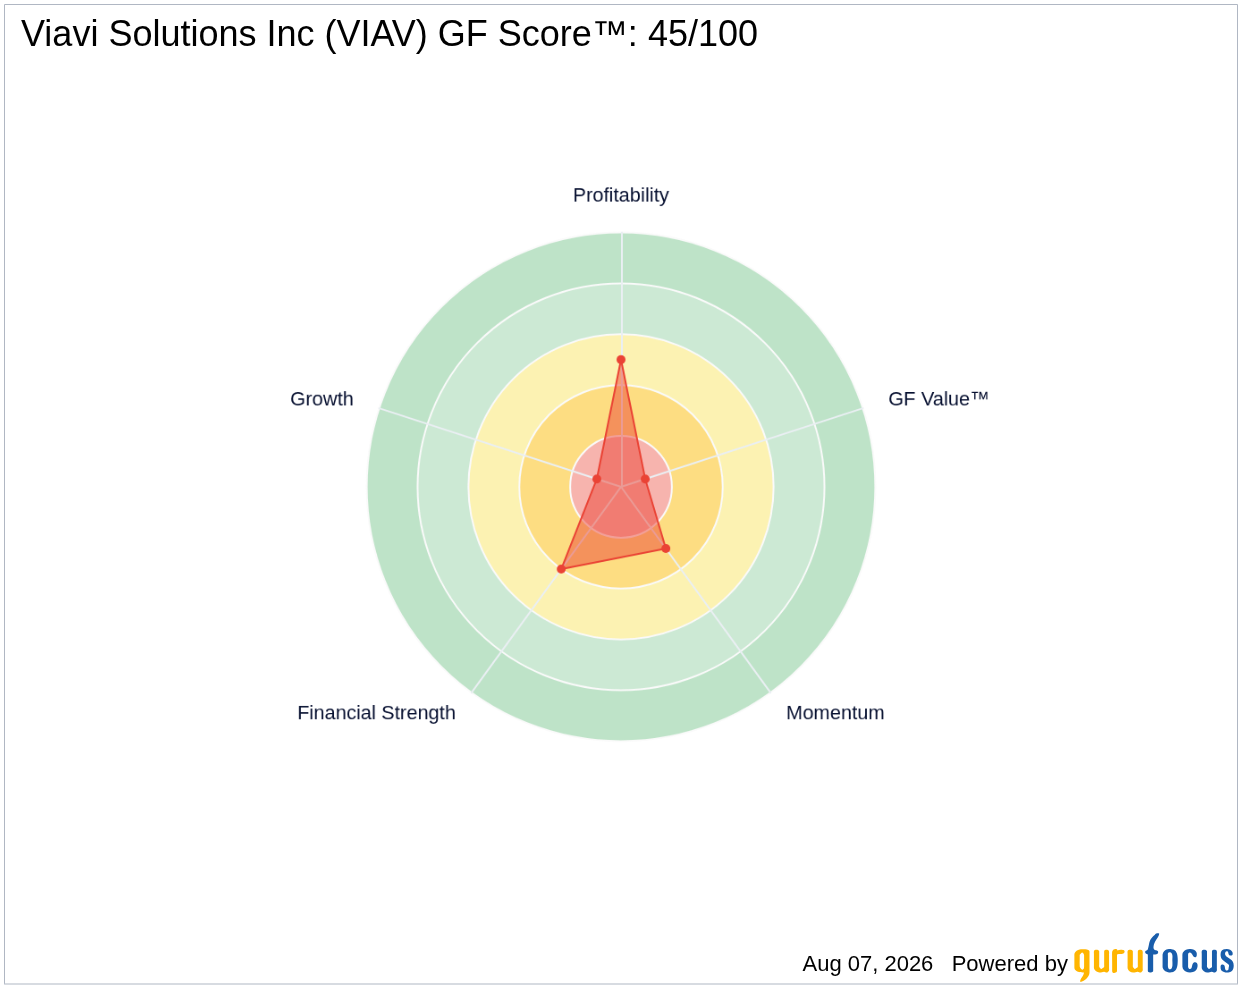
The GF Score™ is a comprehensive metric that evaluates a company's performance based on various factors, including financial strength, profitability, growth potential, valuation, and momentum. With a score of 45/100, VIAV's performance is considered average, and an analysis of its sub-ranks reveals a mixed picture.
| Metric | Rating |
|---|---|
| GF Score™ | 45 |
| Financial Strength | 4/10 |
| Profitability | 5/10 |
| Growth | 1/10 |
| Valuation | 1/10 |
| Momentum | 3/10 |
VIAV's strongest area is profitability, reflected in its score of 5/10, while it struggles significantly in growth and valuation, both marked at 1/10. The low growth rank indicates a lack of momentum, further substantiating the concerns surrounding the company's long-term viability and potential for recovery.
What Are Gurus and Insiders Doing with VIAV?
Currently, five gurus hold shares of Viavi Solutions, with two increasing their positions while seven have chosen to trim their stakes in recent quarters. This mixed guru sentiment suggests a cautious approach to the stock among professional investors. Additionally, insider activity has been notably negative, with insiders selling $13.4 million worth of shares in the last three months without any reported buying. This trend raises red flags about the confidence insiders have in the company's future prospects.
The selling of shares by insiders could imply that those closest to the company are not optimistic about its near-term performance, signaling potential risks for outside investors. The absence of buying activity adds to this caution, suggesting that insiders may prefer to liquidate their holdings rather than invest further in the company.
What This Means for Investors
In summary, Viavi Solutions Inc appears to be significantly overvalued based on the GF Value™ assessment, which indicates a substantial disconnect between the current price and the estimated intrinsic value. This overvaluation, compounded by recent insider selling and a lack of profitability, suggests that investors should approach this stock with caution. For those seeking a deeper understanding of the company's performance and valuation metrics, further details can be found on the Viavi Solutions Inc VIAV stock page.
Frequently Asked Questions
What is VIAV's GF Score™?
VIAV's GF Score™ is 45/100, indicating an average performance when evaluated against various financial metrics.
Is VIAV overvalued or undervalued?
VIAV is considered overvalued, with a GF Value™ estimate of $13.63 compared to its current price of $39.16, suggesting significant downside risk.
What is VIAV's P/E ratio?
VIAV does not have a current P/E ratio due to being unprofitable; however, its forward P/E is 30.5x, which is lower than its historical median of 100.0x but still raises valuation concerns.
This stock alert was generated using automated technology and GuruFocus financial data to provide readers with timely and accurate market reporting. This content was reviewed by GuruFocus editorial team prior to publication. Please send any questions or comments about this story to [email protected].

