


DCF Valuation Analysis for Microsoft Corp MSFT
On August 10, 2026, we delve into the DCF analysis for Microsoft Corp (MSFT), a company that has seen a notable price performance recently, with a 1-month increase of 28.6% and a year-to-date rise of 3.9%. However, over the past year, the stock has experienced a decline of 3.2%.
- DCF Earnings-based intrinsic value of $527.16 vs current price of $499.99 (margin of safety: 5.2%)
- DCF Free Cash Flow-based intrinsic value of $167.67 (significantly overvalued)
- GF Score™ of 97/100 indicates a high level of reliability in the DCF inputs
What Is MSFT Worth? DCF Earnings-Based Model
The DCF earnings-based model for Microsoft Corp utilizes a two-stage approach to estimate intrinsic value. The first stage reflects a high growth phase, while the second stage accounts for a more stable growth rate.
| Parameter | Value |
|---|---|
| Current EPS (TTM, excl. non-recurring) | $16.87 |
| 10-Year Growth Rate | 20.3% |
| 10-Year Treasury Rate | 4.65% |
| Discount Rate (ceil(Treasury) + 6%) | 11% |
| Terminal Growth Rate | 4% |
In the growth phase (Years 1-10), the EPS is projected to grow at 20.3% per year, discounted at a rate of 11%. In the terminal phase (Years 11-20), growth is expected to slow to a 4% terminal rate, also discounted at 11%.
| Stage | Description | Value |
|---|---|---|
| Growth Stage (Years 1-10) | EPS growing at 20.3%, discounted at 11% | $264.29 |
| Terminal Stage (Years 11-20) | 4% terminal growth, discounted at 11% | $262.87 |
| Intrinsic Value | Growth + Terminal | $527.16 |
With a current price of $499.99, the intrinsic value of $527.16 suggests that Microsoft is fairly valued, with a margin of safety of 5.2%. It is important to note that GuruFocus uses EPS excluding non-recurring items, as research indicates that stock prices correlate more closely with earnings than free cash flow. For further details, you can explore the MSFT DCF Calculator.
What Does the Free Cash Flow DCF Say?
The Free Cash Flow (FCF)-based intrinsic value for Microsoft is calculated at $167.67. This starkly contrasts with the earnings-based valuation, indicating a significant disagreement between the two models. The FCF model suggests that Microsoft is significantly overvalued with a margin of safety of -198.2%.
How Does GF Value™ Compare to the DCF Models?
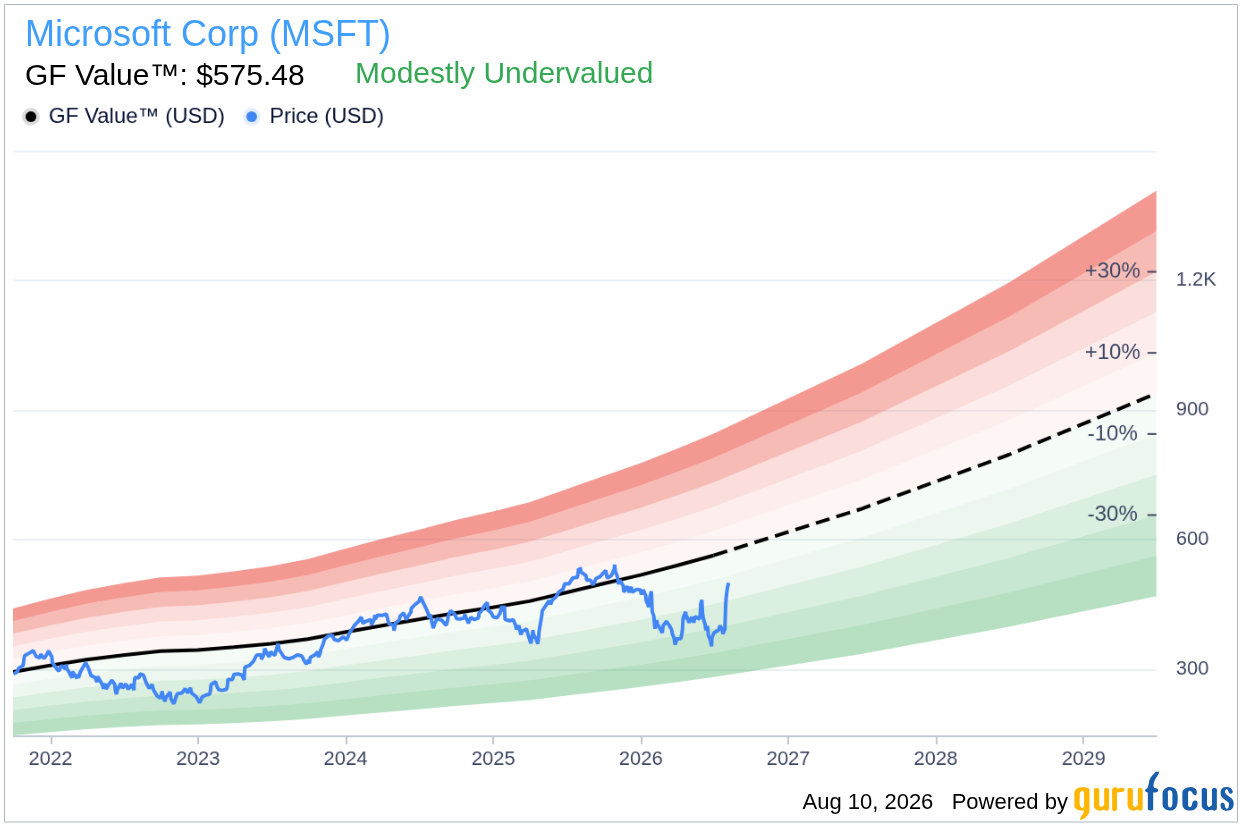
The GF Value™ for Microsoft is calculated at $575.48, providing a third perspective on the company's valuation. GF Value™ is a proprietary measure from GuruFocus that considers historical trading multiples, past business growth, and future performance estimates. The earnings-based DCF and GF Value™ suggest that Microsoft is fairly valued to slightly undervalued, while the FCF model indicates significant overvaluation. This divergence highlights the need for careful consideration of which valuation model may be more reliable in this case. For more insights, visit the GF Value™ page.
What Does MSFT's GF Score™ Tell Us?
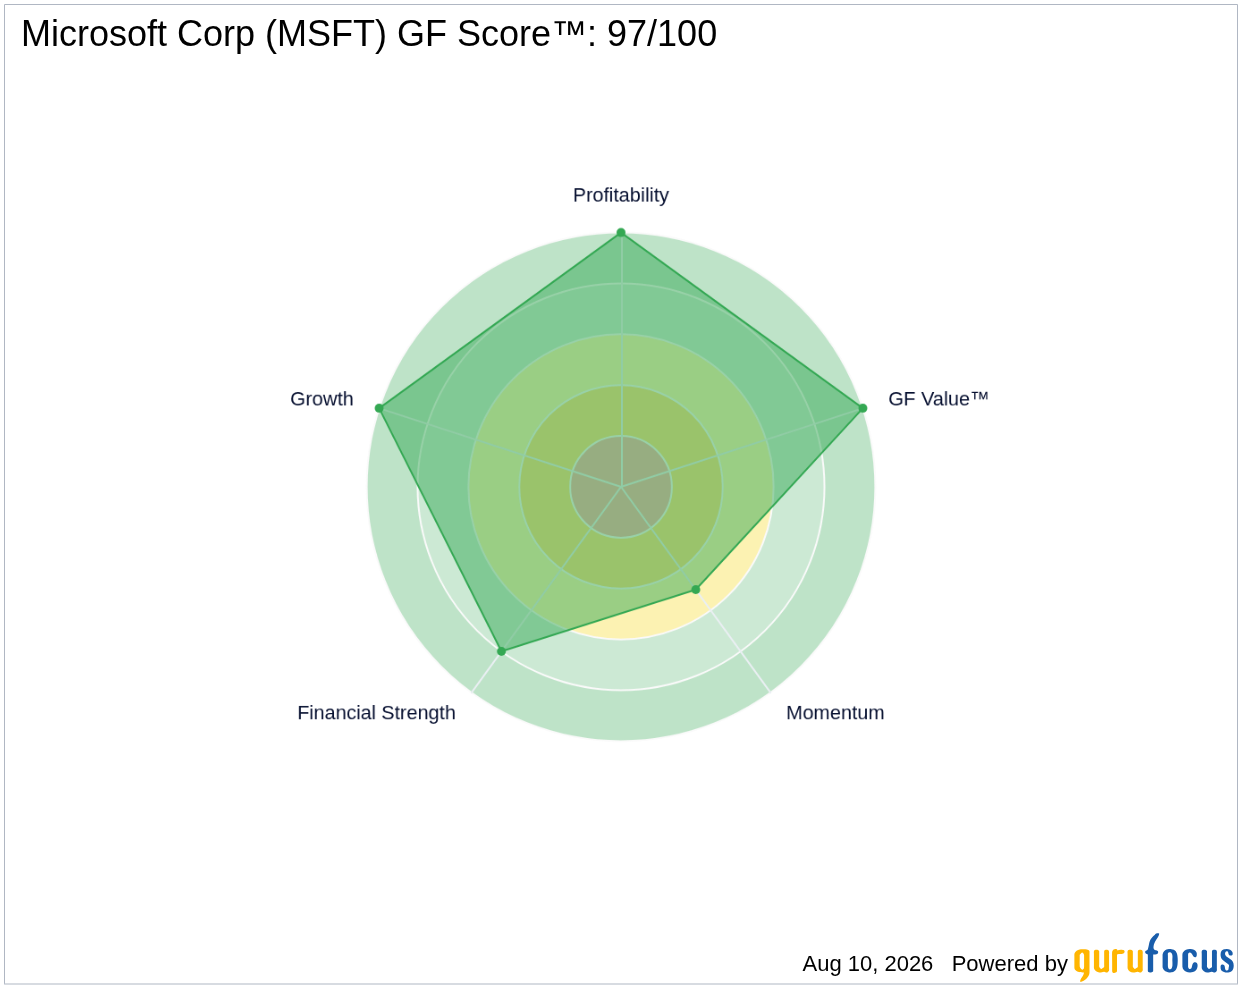
The GF Score™ measures the overall quality of a stock based on various factors, including financial strength, profitability, growth, and valuation. Microsoft boasts a GF Score™ of 97/100, indicating a high-quality stock. The predictability rank of 4/5 stars suggests that the DCF model is more reliable for this stock, enhancing the credibility of the earnings-based valuation.
| Metric | Rating |
|---|---|
| GF Score™ | 97/100 |
| Financial Strength | 8/10 |
| Profitability | 10/10 |
| Growth | 10/10 |
| Valuation | 10/10 |
| Momentum | 5/10 |
For more details on Microsoft’s performance metrics, visit the MSFT stock page.
Key Assumptions and Limitations
It is important to note that DCF models are highly sensitive to assumptions regarding growth rates and discount rates. Stocks with lower predictability ratings tend to yield less reliable DCF estimates. The terminal growth rate of 4% is a simplifying assumption that may not fully capture future market conditions.
What This Means for Investors
In synthesizing the three valuation models—DCF earnings, DCF FCF, and GF Value™—we find a notable tension. The earnings-based DCF and GF Value™ indicate that Microsoft is fairly valued to slightly undervalued, while the FCF model suggests significant overvaluation. This discrepancy highlights the importance of considering which model may be more trustworthy for Microsoft, especially given its high predictability rank. Additionally, the guru ownership signal shows that 61 gurus currently hold the stock, with 25 adding and 35 trimming their positions in recent quarters, while insiders have sold a total of $17.8M in the last three months. This mixed signal from gurus and insiders adds another layer of complexity to the valuation narrative. For further exploration of Microsoft’s valuation, check out the MSFT DCF Calculator.
Frequently Asked Questions
What is MSFT's intrinsic value based on DCF?
Answer: earnings-based $527.16, FCF-based $167.67
Is MSFT overvalued or undervalued?
Answer: The earnings-based DCF suggests fair valuation, while the FCF model indicates significant overvaluation. GF Value™ suggests slight undervaluation.
How reliable is the DCF model for MSFT?
Answer: The DCF model is relatively reliable with a predictability rank of 4/5 stars.
This stock alert was generated using automated technology and GuruFocus financial data to provide readers with timely and accurate market reporting. This content was reviewed by GuruFocus editorial team prior to publication. Please send any questions or comments about this story to [email protected].

