


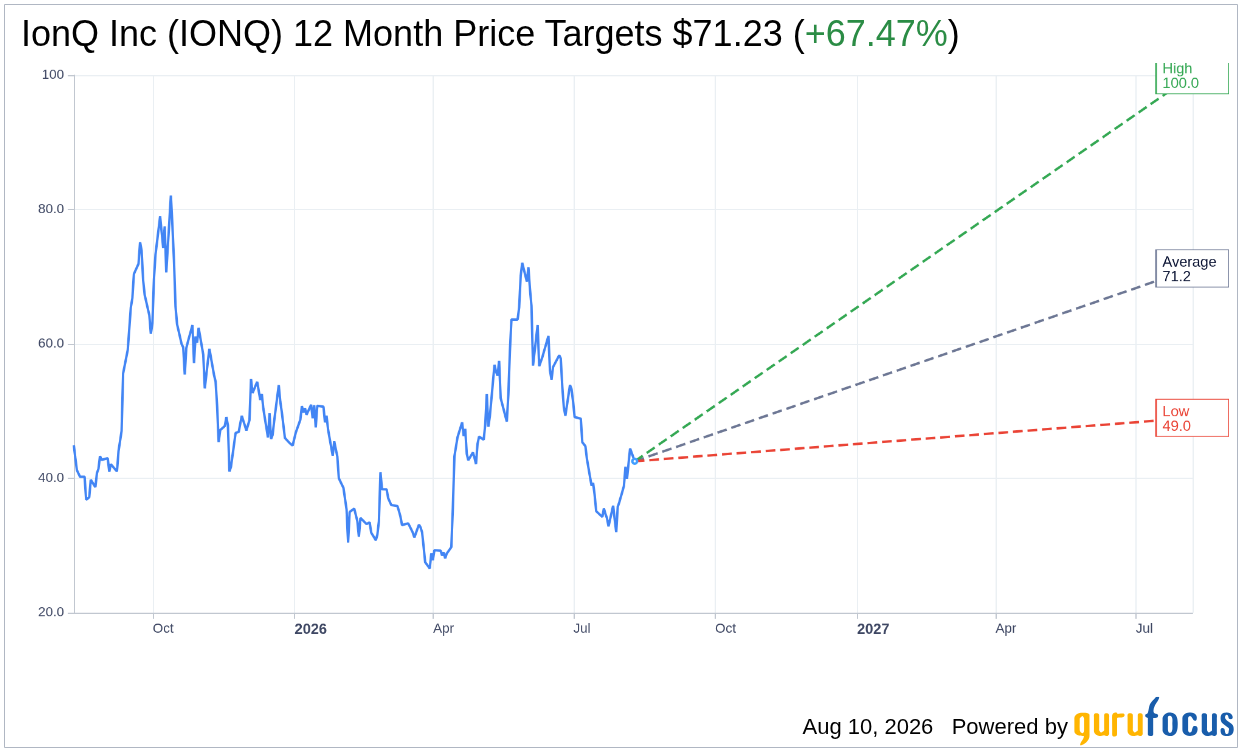
On August 10, 2026, IonQ Inc IONQ shares experienced a decline of 4.3%, bringing the current price to $42.53. Over the past year, the stock has fluctuated within a range of $25.89 to $84.64. The recent price drop adds to a year-to-date decline of 5.2%, although the stock has gained 44.1% over the last three years.
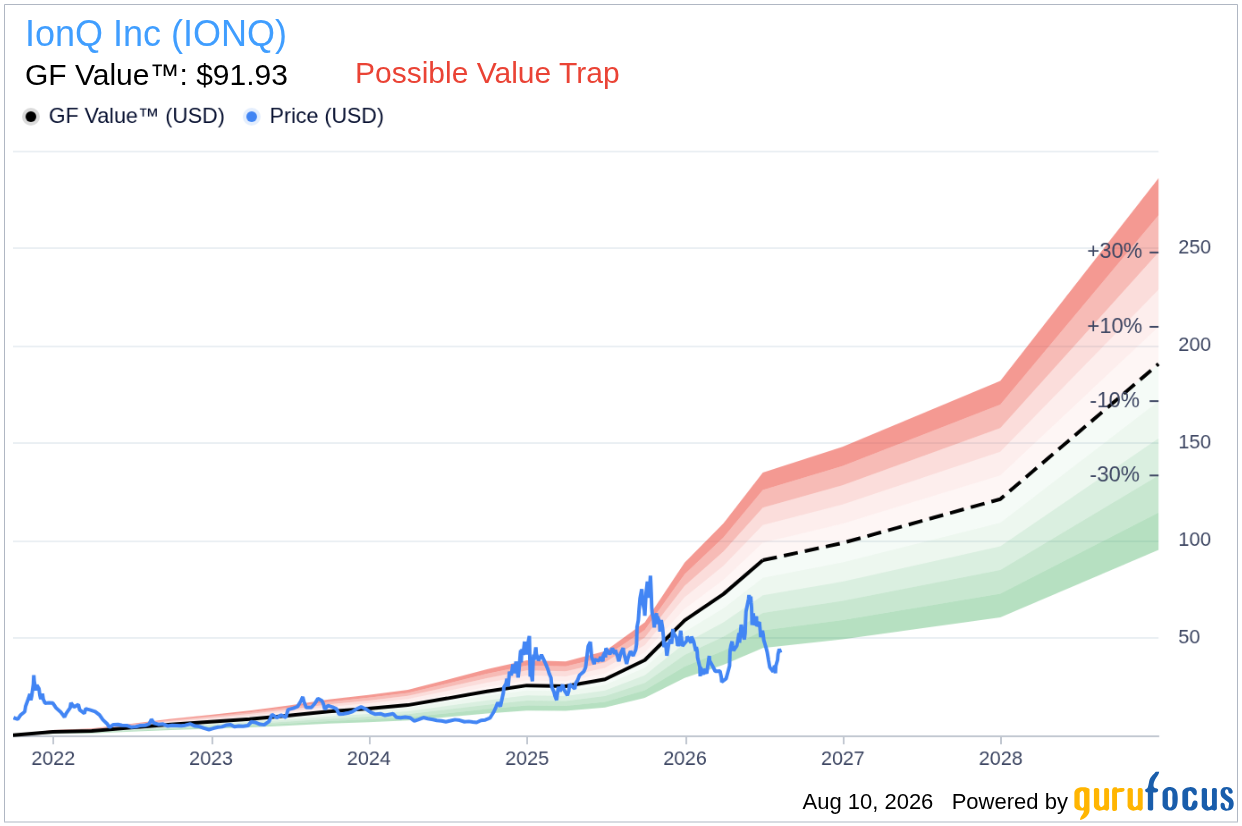
- GF Value™ verdict: Current price of $42.53 vs GF Value of $91.93, indicating a potential upside of 53.7%.
- GF Score™: 47/100, suggesting average performance relative to its peers.
- Most notable signal: Insiders sold $0.5M worth of shares in the last three months with no buying activity.
Is IONQ Overvalued or Undervalued?
The current share price of IonQ Inc IONQ at $42.53 presents an intriguing opportunity considering the GF Value™, which estimates the fair value at $91.93. This indicates that the stock is approximately 53.7% undervalued. However, it is crucial to approach this valuation with caution. GF Value™ is derived from historical trading multiples, business growth patterns, and future performance projections, making it a directional metric rather than a precise target, especially for a company that is currently unprofitable and cash-flow-negative.
The GF Valuation label classifies IonQ as a possible value trap, urging stakeholders to think twice before making investment decisions. While the significant difference between the current price and the GF Value™ may suggest an attractive entry point, the inherent risks associated with a loss-making company should not be overlooked.
How Does IONQ's Valuation Compare to Its History?
As IonQ is unprofitable, traditional earnings-based ratios like the Price-to-Earnings (P/E) ratio are not applicable. Instead, a Price-to-Sales (P/S) analysis could provide more relevant insights. Unfortunately, specific P/S figures are not provided in the current data set. Thus, we are unable to present a historical P/S comparison. However, it is important to consider that IonQ's historical median P/S ratio stands at an exceptionally high level of approximately 141.6x, indicating that any valuation based on sales should be carefully evaluated against this historical context.
What Does IONQ's GF Score™ Tell Us?
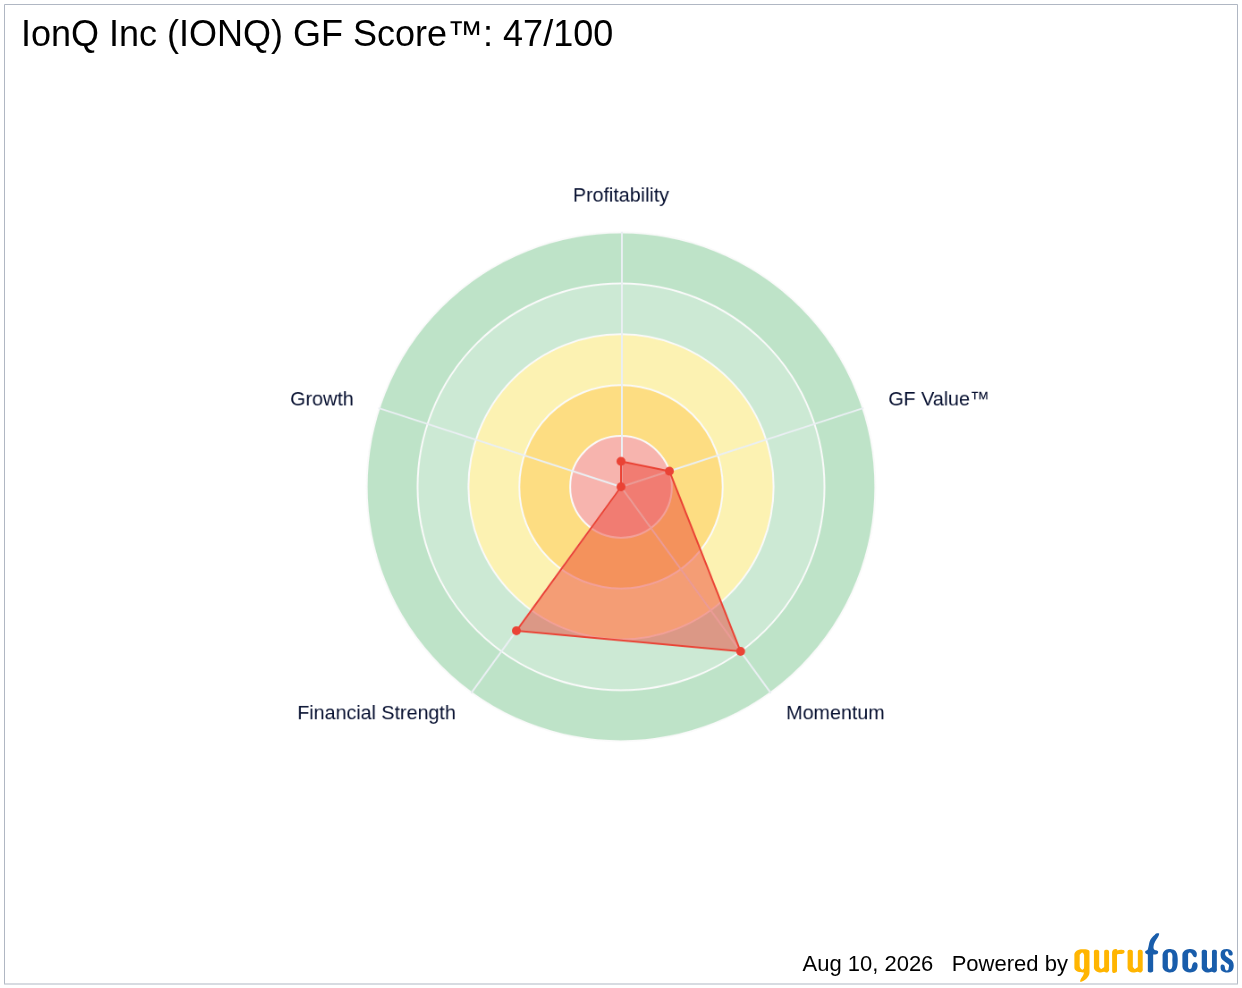
The GF Score™ is a composite metric that evaluates a company's financial strength, profitability, growth potential, valuation, and momentum. IonQ's GF Score™ of 47/100 reflects an average standing among its peers in the sector. The strongest aspect of IonQ's score is its momentum rank of 8/10, indicating positive price trends, while the weakest areas include profitability (1/10) and growth (0/10), suggesting significant challenges in generating profits and expanding.
| Metric | Rating |
|---|---|
| GF Score™ | 47 |
| Financial Strength | 7/10 |
| Profitability | 1/10 |
| Growth | 0/10 |
| Valuation | 2/10 |
| Momentum | 8/10 |
These scores suggest that while IonQ has a solid financial foundation and positive price momentum, it struggles significantly in generating profits and exhibiting growth. Investors should consider these mixed signals when assessing the company's overall potential.
What Are Gurus and Insiders Doing with IONQ?
Currently, four gurus hold IonQ shares, with three adding to their positions in recent quarters while one guru has trimmed their holdings. This activity indicates some level of confidence among institutional investors in IonQ's future prospects. However, the recent insider selling of $0.5M worth of shares without any buying activity raises concerns about insider sentiment. The lack of insider buying could suggest that those with the most intimate knowledge of the company are not confident enough to invest further, which could be a red flag for potential investors.
What This Means for Investors
Taking into account the significant undervaluation indicated by the GF Value™ of $91.93 against the current price of $42.53, IonQ appears to be undervalued. However, the company's challenges in profitability and the potential value trap warning necessitate caution. Investors should weigh these factors carefully before making decisions. For further insights, you can visit the IonQ Inc IONQ stock page, as well as explore the GF Value™ page for additional valuation metrics.
Frequently Asked Questions
What is IONQ's GF Score™?
IONQ's GF Score™ is 47/100, indicating average performance relative to industry peers.
Is IONQ overvalued or undervalued?
According to GF Value™, IONQ is undervalued, with a significant potential upside of 53.7% compared to its estimated fair value.
What is IONQ's P/E ratio?
IONQ does not have a P/E ratio available due to its unprofitable status, making traditional earnings-based valuation metrics inapplicable.
This stock alert was generated using automated technology and GuruFocus financial data to provide readers with timely and accurate market reporting. This content was reviewed by GuruFocus editorial team prior to publication. Please send any questions or comments about this story to [email protected].

