


On August 11, 2026, the Reserve Bank of Australia RBA maintained its key interest rate at 4.35%, a decision reached unanimously, aligning with market expectations. Governor Michele Bullock adopted a hawkish stance, indicating that further monetary tightening is "very likely" in the future.
- GF Value™ verdict: RBA is currently trading at $93.82, which is 11.9% undervalued compared to its GF Value™ of $106.49.
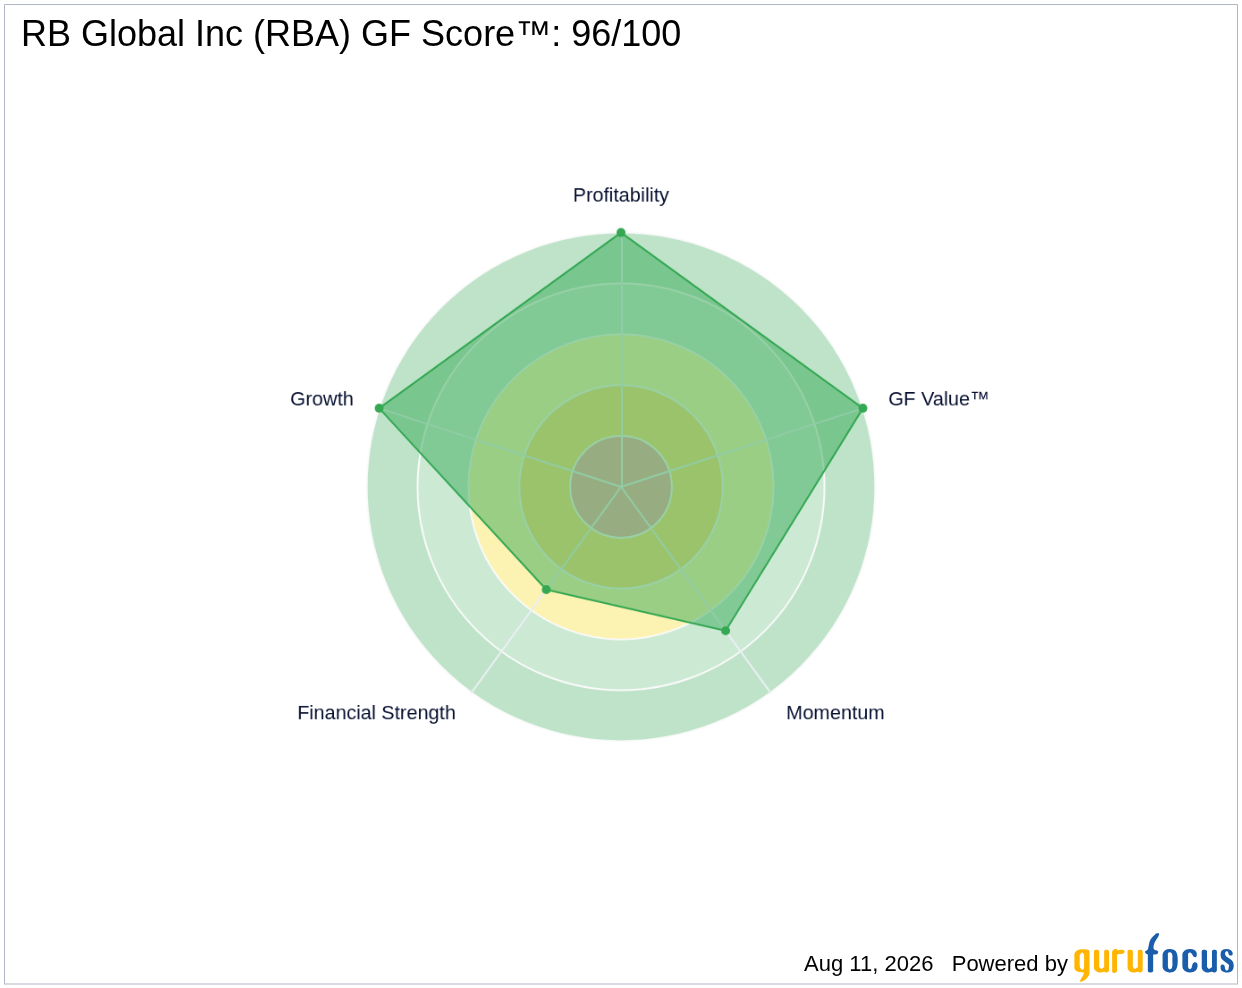
- GF Score™: 96/100, indicating strong overall performance.
- Insider activity shows net buying over the past three months, with no sales reported.
What's Behind the News?
The RBA's decision to hold interest rates steady comes as inflation is projected to reach the midpoint of its target range of 2-3% by early 2028. Governor Bullock emphasized that the current rate hike cycle may not be over, and the committee is considering additional rate increases if necessary. This hawkish tone reflects the RBA's commitment to controlling inflation while navigating the complexities of the Australian economy.
RB Global Inc RBA operates in the industrials sector, specifically within the business services industry. The company has a market capitalization of approximately $17.37 billion and has evolved into a leading global marketplace connecting buyers and sellers of commercial assets and vehicles. The merger of Ritchie Bros. and IAA in 2023 positioned RBA as a significant player in auctions and sales of construction and transportation equipment.
Is RBA Overvalued or Undervalued?
According to GuruFocus, RBA is currently valued at $93.82, which is 11.9% below its GF Value™ of $106.49. This suggests a margin of safety for potential investors, indicating that the stock may be undervalued relative to its intrinsic value. The price-to-earnings (P/E) ratio for RBA stands at 40.55x, which is notably lower than its 5-year median P/E of 47.74x. This discrepancy may suggest that the stock is trading at a more favorable valuation compared to its historical performance. For more details, visit the GF Value™ page.
What Does RBA's GF Score™ Tell Us?
The GF Score™ is a comprehensive measure that evaluates a company's financial strength, profitability, growth potential, valuation, and momentum. RBA's impressive GF Score™ of 96/100 reflects its strong performance across multiple metrics, particularly in profitability and growth, where it ranks a perfect 10/10. However, its financial strength is rated at 5/10, indicating some areas for improvement.
| Metric | Rating |
|---|---|
| GF Score™ | 96 |
| Financial Strength | 5 |
| Profitability | 10 |
| Growth | 10 |
| Valuation | 10 |
| Momentum | 7 |
RBA's strengths lie in its profitability and growth potential, both of which are critical indicators of a company's ability to generate returns. However, the financial strength rating suggests that there may be some vulnerabilities that investors should monitor closely. For further insights, check the RBA stock page.
What Are Gurus and Insiders Doing with RBA?
Currently, 8 gurus hold positions in RBA, with 5 adding to their stakes and 4 trimming their holdings in recent quarters. This indicates a generally positive sentiment among seasoned investors. Additionally, insider activity reflects a net buying trend over the past three months, with no sales reported, which may signal confidence in the company's future performance.
What This Means for Investors
Given the current undervaluation of RBA, as indicated by its GF Value™ and strong GF Score™, the company presents a compelling case for investors looking for growth opportunities in the industrials sector. The positive insider activity further reinforces this outlook. For more information on RBA and its performance metrics, visit the RBA stock page.
Frequently Asked Questions
What is RBA's GF Score™?
RBA's GF Score™ is 96/100, indicating a strong overall performance based on various financial metrics.
Is RBA overvalued or undervalued?
RBA is currently undervalued, trading at $93.82, which is 11.9% below its GF Value™ of $106.49.
What is RBA's P/E ratio compared to historical?
RBA's P/E ratio is 40.55x, which is lower than its 5-year median P/E of 47.74x, suggesting a more favorable valuation.
This stock alert was generated using automated technology and GuruFocus financial data to provide readers with timely and accurate market reporting. This content was reviewed by GuruFocus editorial team prior to publication. Please send any questions or comments about this story to [email protected].

