


On August 11, 2026, Tencent Music Entertainment Group (NYSE: TME) released its Q2 earnings report, showcasing solid financial results and reinforcing its position as a dividend-paying stock with attractive valuation metrics. Key highlights include:
- TME offers a dividend yield of 2.46% with a conservative payout ratio of 28%, though dividend growth has been flat over the past three years. The company’s GF Value™ of $15.65 versus the current price of $9.90 supports a thesis of significant undervaluation, suggesting room for capital appreciation alongside income.
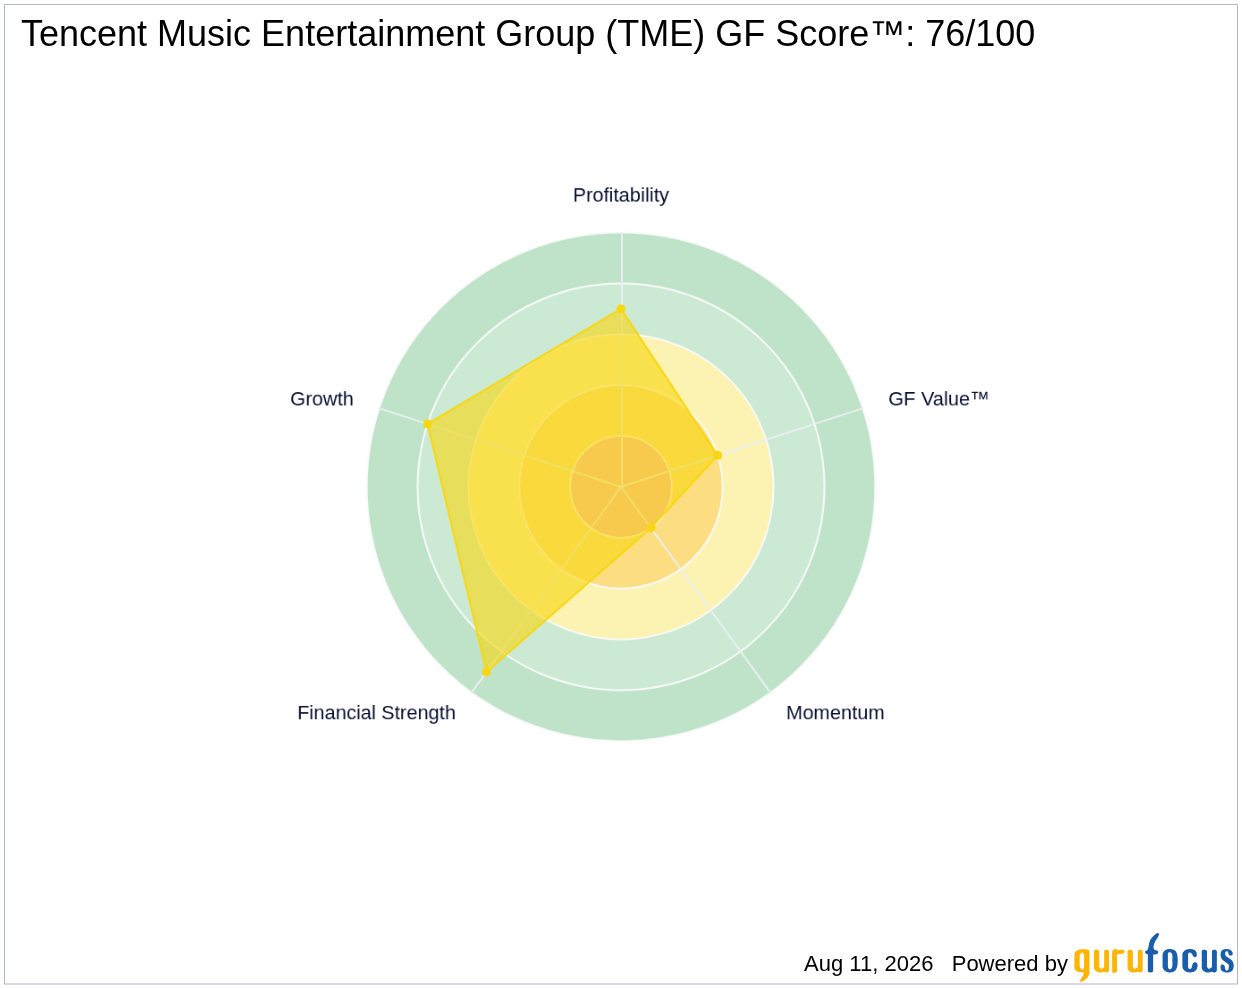
- The firm’s GF Score™ stands at a robust 76 out of 100, indicating strong overall fundamentals, particularly in financial strength and growth metrics.
- From a financial health perspective, TME boasts a strong balance sheet with an Altman Z-Score of 4.26 and a comfortable interest coverage ratio of 69.37, underscoring its ability to sustain dividends and manage debt effectively.
What's Behind the News?
Tencent Music Entertainment’s Q2 earnings announcement highlighted a Non-GAAP EPS of $0.25, slightly above analyst expectations, alongside revenue growth of 11.9% year-over-year to $1.32 billion. This performance reflects steady demand for its music and membership services, which grew 11.0% and 8.1% respectively. The company’s strong cash position, with RMB44.22 billion (approximately $6.52 billion) in cash and equivalents as of June 30, further reinforces its financial stability.
Founded in 2016 through the merger of QQ Music, Kuwo Music, and Kugou Music, Tencent Music Entertainment Group is the largest online music streaming platform in China. It operates within the Communication Services sector, specifically the Interactive Media industry. With a market capitalization of $16.21 billion, TME benefits from Tencent’s majority ownership, which holds over 50% of shares and more than 90% of voting rights. Beyond streaming, the company monetizes through podcasts, livestreaming, concerts, and karaoke, diversifying its revenue streams.
Is TME's Dividend Safe and Attractive?
TME currently offers a dividend yield of 2.46%, which is moderately attractive in the context of the Communication Services sector. The payout ratio stands at a conservative 28%, indicating that the company distributes less than one-third of its earnings as dividends. However, dividend growth has been stagnant over the past three years, signaling a cautious approach to increasing shareholder payouts. Despite the lack of dividend growth, the low payout ratio combined with strong cash reserves and financial strength suggests that the dividend is sustainable and unlikely to be cut in the near term.
Supporting this dividend thesis is TME’s GF Value™ of $15.65, which is 36.7% higher than its current trading price of $9.90. This significant undervaluation implies that investors are potentially receiving a safe dividend yield at a discount to intrinsic value, offering a compelling risk-reward profile for income-focused investors. For more details on how GF Value™ is calculated and its implications, see GF Value™.
What Does TME's GF Score™ Tell Us?
The GF Score™ is a comprehensive metric developed by GuruFocus that evaluates a company’s overall quality by combining financial strength, profitability, growth, valuation, and momentum factors. Tencent Music’s GF Score™ of 76/100 reflects a well-rounded business with particular strengths and some areas for improvement.
| Metric | Rating (out of 10) |
|---|---|
| GF Score™ | 76 |
| Financial Strength | 9 |
| Profitability | 7 |
| Growth | 8 |
| Valuation | 4 |
| Momentum | 2 |
TME’s strongest attributes lie in its financial strength and growth, with a near-perfect score of 9 in balance sheet health and an 8 in growth metrics, reflecting consistent revenue and EBITDA expansion over recent years. Profitability is solid at 7, supported by expanding operating margins and strong net margins. Valuation ranks lower at 4, which aligns with the current market price being below intrinsic value, indicating a buying opportunity. Momentum is the weakest area at 2, suggesting recent price trends have been subdued or volatile, possibly due to sector headwinds or broader market conditions. For a deeper dive, visit the TME stock page.
What Are Gurus and Insiders Doing with TME?
GuruFocus tracks 143 premium gurus, of which 6 currently hold Tencent Music Entertainment shares. In recent quarters, 6 gurus have trimmed their positions while 2 have added to theirs, indicating a mixed but cautious stance among top investors. This nuanced guru activity suggests some skepticism or profit-taking amid valuation concerns, balanced by confidence from a smaller group of buyers. Insider activity is notably absent, with no insider purchases or sales reported in the past 12 months, reflecting a lack of material insider trading signals at this time.
What This Means for Investors
For income-oriented investors, Tencent Music Entertainment presents a dividend stock with a sustainable payout supported by a strong balance sheet and ample cash reserves. The modest yield of 2.46% combined with a low payout ratio reduces the risk of dividend cuts, although the absence of dividend growth tempers enthusiasm for income growth. The company’s significant undervaluation per GF Value™ and solid GF Score™ reinforce the case for potential capital appreciation alongside steady income. However, mixed guru ownership trends and weak momentum caution investors to monitor market developments closely. Investors seeking a blend of dividend safety and value may find TME worthy of further consideration. Explore more on the TME stock page or use the GuruFocus Stock Screener to compare with peers.
Frequently Asked Questions
What is TME's GF Score™?
TME’s GF Score™ of 76/100 reflects strong financial health, solid profitability, and good growth prospects, though valuation and momentum metrics are less favorable.
Is TME's dividend safe?
Yes, with a dividend yield of 2.46% and a conservative payout ratio of 28%, TME’s dividend appears sustainable despite no recent growth in payouts.
What is TME's P/E ratio compared to historical?
TME’s current trailing P/E ratio is 12.27x, which is below its 5-year median P/E of 20.18x, indicating the stock is trading at a discount relative to its historical earnings multiple.
This stock alert was generated using automated technology and GuruFocus financial data to provide readers with timely and accurate market reporting. This content was reviewed by GuruFocus editorial team prior to publication. Please send any questions or comments about this story to [email protected].

