

On August 11, 2026, Ryan Rasmussen, Head of Research at Bitwise, projected explosive growth in the stablecoin sector, forecasting an increase from $300 billion to between $3 trillion and $5 trillion. He emphasized Circle Internet Group Inc (NYSE: CRCL) as a prime beneficiary of this trend, citing its strong stablecoin market position and evolving payments platform strategy. Following this news, CRCL shares surged nearly 9% in morning trading to $73.15.
- Price-to-Earnings (P/E) ratio stands at 49.93x, slightly above its 5-year median of 45.66x, reflecting a premium valuation.
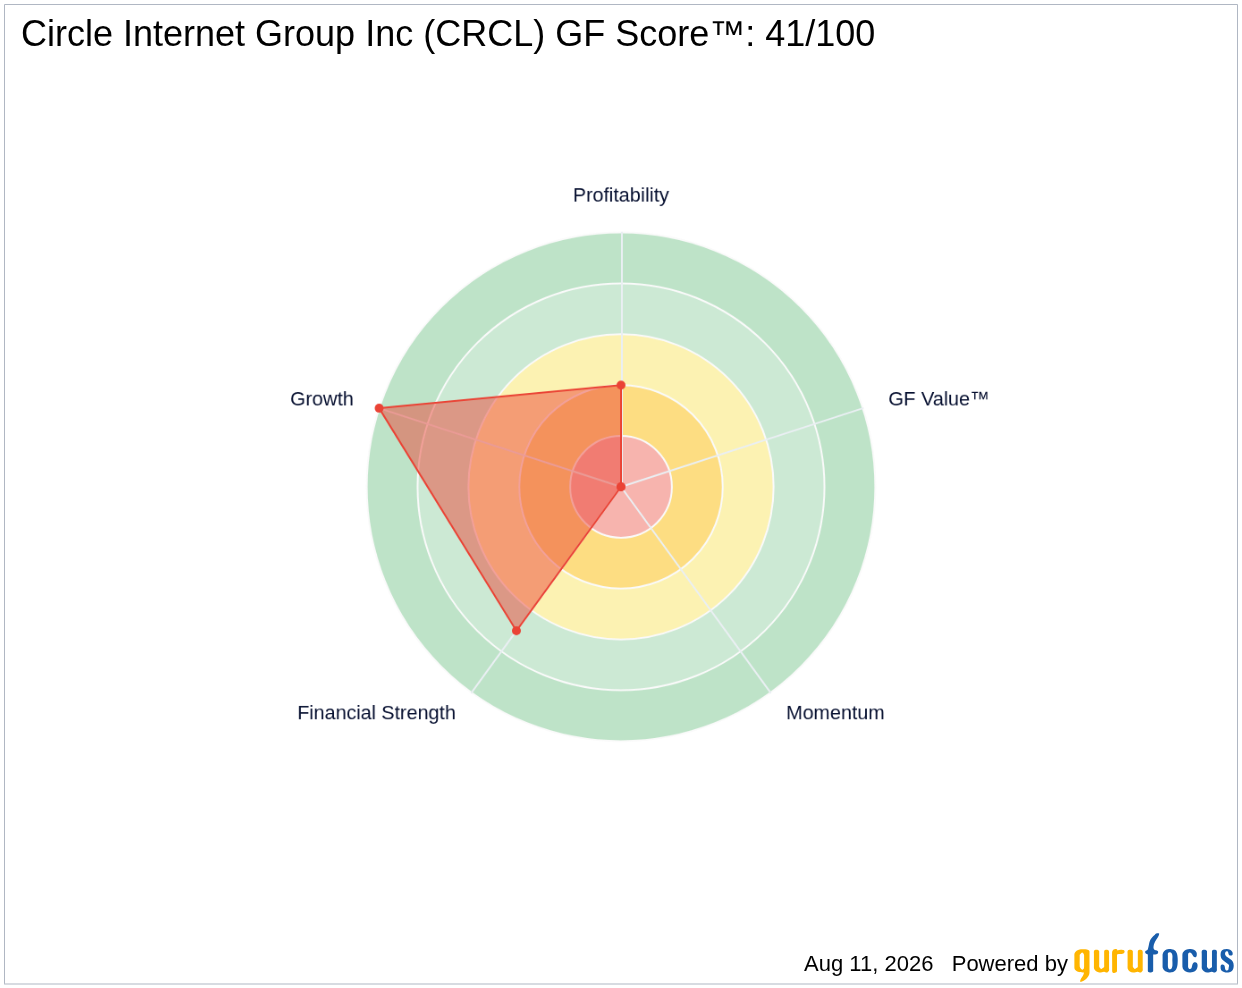
- GF Score™ of 41/100 indicates moderate overall fundamentals with notable growth strength but weaknesses in profitability and financial health.
- Insider activity shows significant selling with no insider purchases in the past three months, totaling $162.3 million in shares sold.
What's Behind the News?
Ryan Rasmussen’s bullish outlook on the stablecoin market underscores a transformative opportunity for Circle Internet Group Inc, a company deeply embedded in digital currencies and blockchain technology. His forecast of the stablecoin sector expanding tenfold or more over the next several years places Circle in a pivotal position to capitalize on regulatory clarity and increased adoption. Rasmussen’s confidence that Circle will evolve from a stablecoin provider into a comprehensive payments platform signals a strategic pivot that could broaden its revenue streams and market influence.
Circle Internet Group Inc operates within the Financial Services sector, specifically in the Capital Markets industry. The company’s platform integrates blockchain infrastructure, digital asset services, and payment applications, positioning it as a full-stack fintech innovator. With a market capitalization of $18.51 billion, Circle is a significant player in the digital currency ecosystem, headquartered at One World Trade Center, New York.
How Is CRCL Valued?
Currently, GF Value™ data is not available for Circle, which limits a direct assessment of intrinsic valuation through GuruFocus’s proprietary metric. However, the company’s trailing twelve months (TTM) P/E ratio of 49.93x is modestly above its 5-year median P/E of 45.66x, suggesting the stock trades at a premium relative to its historical earnings multiple. This premium valuation may reflect investor optimism about Circle’s growth prospects in the burgeoning stablecoin and payments market. The forward P/E ratio is not available, which adds uncertainty to near-term earnings expectations.
Investors can review detailed valuation and financial metrics on the CRCL stock page for ongoing updates and comparative analysis.
What Does CRCL's GF Score™ Tell Us?
The GF Score™ is a composite gauge designed to encapsulate a company’s overall financial health, profitability, growth, valuation, and momentum into a single score. For Circle, the GF Score™ is 41 out of 100, indicating a mixed fundamental profile. The company’s strongest attribute lies in its growth rank, which scores a perfect 10 out of 10, reflecting robust revenue and EBITDA growth rates over the past three years (69% revenue growth and 64.2% EBITDA growth). Conversely, profitability ranks low at 4 out of 10, indicating margin pressures or inefficiencies, while financial strength is moderate at 7 out of 10, constrained by a low Altman Z-Score of 0.21 signaling distress risk.
| Metric | Rating |
|---|---|
| GF Score™ | 41/100 |
| Financial Strength | 7/10 |
| Profitability | 4/10 |
| Growth | 10/10 |
Circle’s valuation and momentum metrics are not rated, reflecting either data limitations or mixed signals. The company’s growth leadership is a clear strength, but investors should weigh this against the modest profitability and financial health indicators. For more comprehensive insights, visit the CRCL stock page.
What Are Gurus and Insiders Doing with CRCL?
GuruFocus tracks 9 premium gurus holding CRCL, with 8 increasing their positions and 5 trimming stakes in recent quarters. This net positive guru buying activity suggests institutional confidence in Circle’s long-term prospects, particularly from investment professionals who actively manage large portfolios. In contrast, insider activity reveals a different narrative: insiders have sold over $162 million worth of shares in the past three months, with no insider purchases reported. This significant insider selling may indicate caution or portfolio rebalancing at the executive level, which investors should consider alongside guru ownership trends.
What This Means for Investors
Circle Internet Group’s current valuation presents a nuanced picture. While the company is trading at a premium P/E relative to its historical median, the absence of GF Value™ data leaves some ambiguity about its intrinsic worth. The GF Score™ of 41/100 highlights Circle’s exceptional growth potential but also flags concerns around profitability and financial stability. The contrasting signals from guru buying and insider selling add another layer of complexity, suggesting that while institutional investors see opportunity, insiders may be exercising caution. Investors should carefully weigh these factors in the context of the rapidly evolving stablecoin and payments landscape. For those seeking detailed financial and valuation updates, the CRCL stock page remains a valuable resource.
Frequently Asked Questions
What is CRCL's GF Score™?
CRCL’s GF Score™ is 41 out of 100, reflecting strong growth but weaker profitability and moderate financial strength. This score aggregates multiple financial metrics to provide an overall assessment of the company’s fundamentals.
How is CRCL valued?
Circle’s valuation is characterized by a trailing P/E ratio of 49.93x, slightly above its 5-year median of 45.66x. GF Value™ data is not available, so valuation must be assessed through traditional multiples and market context.
What is CRCL's P/E ratio compared to historical?
The current P/E ratio of 49.93x is modestly higher than the 5-year median P/E of 45.66x, indicating that the stock is trading at a premium relative to its historical earnings multiples.
This stock alert was generated using automated technology and GuruFocus financial data to provide readers with timely and accurate market reporting. This content was reviewed by GuruFocus editorial team prior to publication. Please send any questions or comments about this story to [email protected].

