

On August 11, 2026, Life360 Inc (NASDAQ: LIF) experienced a sharp decline in its share price, plunging 25.9% or $16.71 to close at $47.90. This significant drop highlights growing investor caution around the company’s valuation and insider activity.
- Price-to-Earnings (TTM) ratio stands at 27.57x, well below its 5-year median of 188.24x, signaling a valuation contraction.
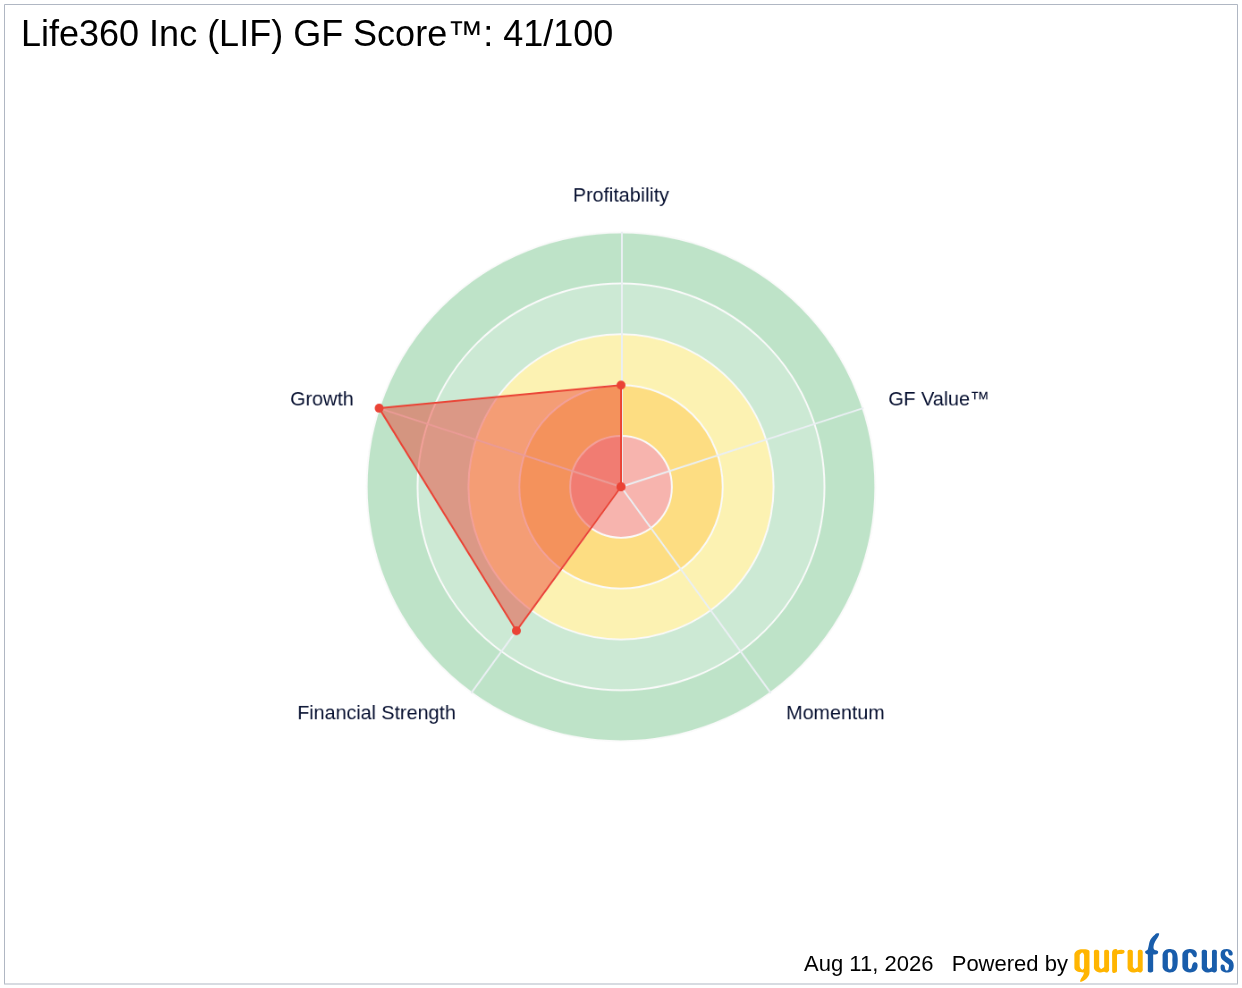
- GF Score™ of 41/100 reflects mixed fundamentals, with strong growth offset by weaker profitability and financial strength.
- Insider activity shows no insider buying but $6.5 million in insider sales over the past three months, indicating potential caution from company insiders.
What's Behind the News?
The 25.9% plunge in Life360’s stock price on August 11, 2026, marks a notable market reaction to concerns over the company’s valuation and insider behavior. Such a steep decline in a single day often reflects investor reassessment of growth prospects, profitability, or external factors impacting the technology sector. For Life360, this drop compounds a year-to-date decline of over 25%, underscoring persistent headwinds despite its position in the family-focused social networking space.
Life360 is the world’s largest family-oriented social network, boasting nearly 100 million monthly active users. The company’s app offers location tracking for family members, pets, and personal belongings, alongside safety features like driver monitoring and emergency dispatch. Operating within the technology sector under the software industry, Life360 holds a market capitalization of $3.89 billion, positioning it as a mid-cap player focused on consumer safety and social connectivity.
How Is LIF Valued?
While GF Value™ data is not available for Life360, valuation can be assessed through traditional metrics. The trailing twelve months (TTM) price-to-earnings ratio of 27.57x is significantly lower than its 5-year median P/E of 188.24x, indicating a sharp contraction in investor valuation multiples. However, the forward P/E ratio is elevated at 36.63x, suggesting that earnings expectations may be under pressure or that investors anticipate slower growth ahead. This divergence between trailing and forward P/E ratios often signals caution about future profitability.
Additional valuation metrics such as a price-to-sales ratio of 7.73 and a price-to-book ratio of 6.47 further reflect a premium valuation relative to typical software peers. The enterprise value to EBITDA ratio is notably high at 149.9, underscoring the market’s current pricing of Life360’s earnings potential despite modest operating margins near 1.65%. Investors can explore more details on Life360’s valuation and financials on the LIF stock page.
What Does LIF's GF Score™ Tell Us?
The GF Score™ aggregates multiple dimensions of a company’s financial health, profitability, growth, valuation, and momentum into a single comprehensive rating. Life360’s GF Score™ of 41 out of 100 indicates mixed performance, with notable strengths in growth but weaknesses in profitability and valuation metrics.
| Metric | Rating |
|---|---|
| GF Score™ | 41 |
| Financial Strength | 7/10 |
| Profitability | 4/10 |
| Growth | 10/10 |
Life360’s strongest attribute is its growth rank, which scores a perfect 10 out of 10, reflecting robust revenue growth of 16.5% over three years and an extraordinary 4195% one-year earnings growth—albeit from a low base. Conversely, profitability ranks only 4 out of 10, with slim operating margins of 1.65% and a net margin of 28.21%, indicating uneven earnings quality. Financial strength is moderate at 7 out of 10, supported by a strong Altman Z-Score of 8.05, signaling low bankruptcy risk, but tempered by concerns such as asset growth outpacing revenue growth and a return on invested capital (ROIC) below the weighted average cost of capital (WACC). Valuation and momentum sub-ranks are not available or zero, limiting a full picture of market sentiment. For a deeper dive, visit the LIF stock page.
What Are Gurus and Insiders Doing with LIF?
GuruFocus tracks that two premium gurus currently hold Life360 shares, with one guru adding to their position and two trimming theirs in recent quarters. This mixed guru activity suggests cautious optimism but also some profit-taking among sophisticated investors. Insider activity reveals no insider purchases in the last three months, while insiders have sold approximately $6.5 million worth of shares during the same period. Over the past year, insider selling has been more pronounced, with 49 transactions totaling over $71 million in sales and no insider buying reported. This insider selling trend may signal management’s lack of confidence in near-term stock appreciation or a desire to diversify holdings.
What This Means for Investors
Life360’s current valuation landscape presents a complex picture. Despite a relatively moderate trailing P/E ratio compared to its historical median, the elevated forward P/E and absence of GF Value™ data leave uncertainty about the stock’s margin of safety. The GF Score™ of 41/100 highlights strong growth potential but flags concerns in profitability and valuation discipline. The insider selling activity and mixed guru ownership trends further temper enthusiasm, suggesting that both company insiders and some institutional investors are cautious. For investors weighing Life360’s prospects, these factors underscore the importance of scrutinizing valuation and monitoring insider behavior closely. More insights and updated data can be found on the LIF stock page.
Frequently Asked Questions
What is LIF's GF Score™?
Life360’s GF Score™ is 41 out of 100, indicating a mixed financial profile with strong growth but weaker profitability and valuation metrics.
How is LIF valued?
Life360 trades at a trailing P/E of 27.57x, significantly below its 5-year median of 188.24x, but the forward P/E is higher at 36.63x, reflecting investor caution about future earnings.
What is LIF's P/E ratio compared to historical?
The current trailing P/E ratio of 27.57x is much lower than its historical 5-year median of 188.24x, suggesting a substantial contraction in valuation multiples over time.
- CEO Buys, CFO Buys: Stocks that are bought by their CEO/CFOs.
- Insider Cluster Buys: Stocks that multiple company officers and directors have bought.
- Double Buys: Companies that both Gurus and Insiders are buying
- Triple Buys: Companies that both Gurus and Insiders are buying, and Company is buying back.
This stock alert was generated using automated technology and GuruFocus financial data to provide readers with timely and accurate market reporting. This content was reviewed by GuruFocus editorial team prior to publication. Please send any questions or comments about this story to [email protected].

