


On August 11, 2026, Newmont Corp (NYSE: NEM) shares surged nearly 12% over the past week, closing at $116.81 on Tuesday. This strong price action has pushed the stock well above its intrinsic valuation as measured by GuruFocus' proprietary GF Value™ metric.
- GF Value™ verdict: Current price of $116.27 is 47.3% above the GF Value™ of $78.96, indicating significant overvaluation.
- GF Score™: A robust 85/100, reflecting strong financial health and momentum despite valuation concerns.
- Insider activity: No insider buying reported in the last three months, with insiders selling $3.3 million worth of shares, signaling cautious sentiment.
What's Behind the News?
The recent rally in Newmont’s shares comes amid a backdrop of solid operational performance and positive analyst sentiment. The stock’s nearly 12% gain over the last week has helped it outperform the broader S&P 500 index year-to-date, with an 18.36% gain compared to the S&P’s 13.26%. Despite some profit-taking and a slight cooling in momentum, the stock has found support near the $116 level, suggesting a consolidation phase rather than a reversal.
Newmont Corp is the world’s largest gold miner, with a diversified portfolio spanning 11 mines and interests across the Americas, Africa, Australia, and Papua New Guinea. The company’s market capitalization stands at $122.51 billion, positioning it as a heavyweight in the Basic Materials sector and the Metals & Mining industry. Newmont’s operations are not limited to gold; it also produces copper, silver, zinc, and lead as byproducts, enhancing its revenue streams and operational resilience.
Is NEM Overvalued or Undervalued?
GuruFocus’ GF Value™ model estimates Newmont’s intrinsic value at $78.96 per share, which is substantially below the current trading price of $116.27. This 47.3% premium suggests that the stock is significantly overvalued from a fundamental perspective, leaving a limited margin of safety for new investors. The GF Value™ calculation incorporates historical trading multiples, past business growth, and future earnings projections, providing a comprehensive valuation benchmark.
Looking at valuation multiples, Newmont’s trailing twelve months (TTM) price-to-earnings (P/E) ratio stands at 14.68x, which is actually below its 5-year median P/E of 16.42x. This indicates that while the stock price is elevated relative to GF Value™, it is not excessively stretched on an earnings basis compared to its recent historical norms. However, the GF Value™ metric, which integrates multiple valuation and growth factors, still flags the stock as significantly overvalued. Investors seeking a deeper dive into this valuation can explore the GF Value™ methodology and data.
What Does NEM's GF Score™ Tell Us?
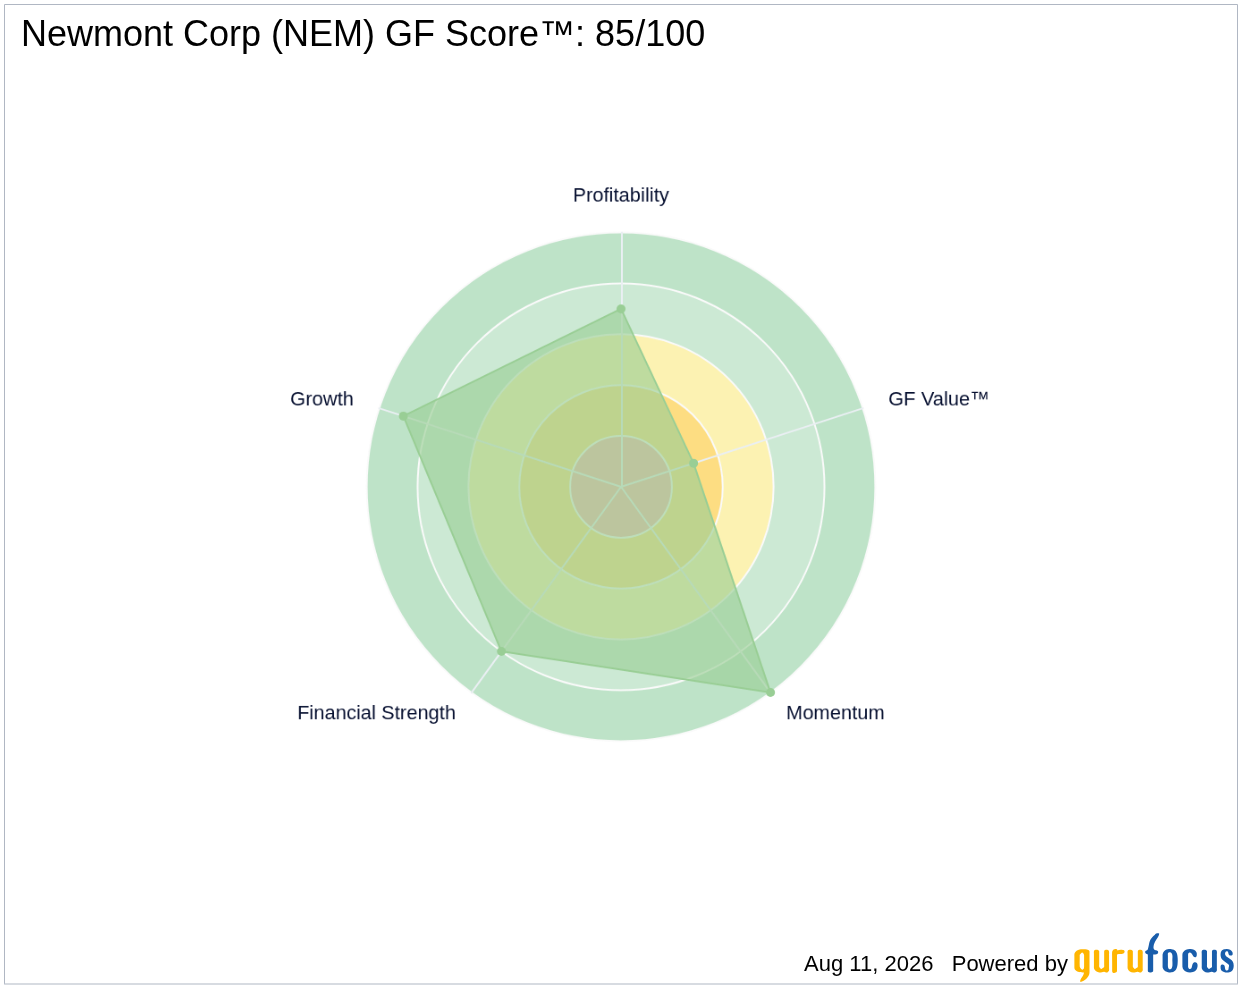
The GF Score™ is a composite measure designed to assess a company’s overall financial health, profitability, growth, valuation, and momentum. Newmont’s strong GF Score™ of 85 out of 100 reflects its solid fundamentals and positive market dynamics. The company scores particularly well in financial strength and momentum, while valuation remains its weakest area, consistent with the GF Value™ overvaluation signal.
| Metric | Rating (out of 10) |
|---|---|
| GF Score™ | 85 |
| Financial Strength | 8 |
| Profitability | 7 |
| Growth | 9 |
| Valuation | 3 |
| Momentum | 10 |
Newmont’s financial strength rating of 8/10 is supported by a strong Altman Z-Score of 4.86 and a high Piotroski F-Score of 9, indicating a very healthy balance sheet and low bankruptcy risk. Its momentum score is perfect at 10/10, reflecting the recent strong price gains and positive market sentiment. Conversely, the valuation rank of 3/10 highlights the premium investors are paying relative to intrinsic value. For more details, visit the NEM stock page.
What Are Gurus and Insiders Doing with NEM?
GuruFocus tracks 15 premium gurus holding Newmont shares, with a near-even split in recent quarters: 6 gurus have increased their positions while 7 have trimmed theirs. This mixed activity suggests a cautious but generally positive stance among top investors who often have deep research capabilities. Insider activity, however, shows no insider buying in the past three months and insider selling totaling $3.3 million, which may indicate some profit-taking or lack of conviction from management and insiders at current price levels. This insider and guru ownership data is a unique insight provided by GuruFocus, not available on platforms like Simply Wall St or Morningstar.
What This Means for Investors
While Newmont’s shares have demonstrated strong momentum and the company boasts robust financial health and growth prospects, the significant premium to GF Value™ suggests investors should be cautious about valuation risk. The 47.3% overvaluation implies limited margin of safety, especially given the insider selling and mixed guru ownership trends. Momentum and financial strength are clear positives, but the valuation gap signals that the current price may already reflect optimistic expectations. Investors interested in Newmont should monitor valuation metrics closely and consider the balance between strong fundamentals and stretched price levels. For a full overview of Newmont’s fundamentals and market data, explore the NEM stock page or use the GuruFocus Stock Screener to identify other opportunities.
Frequently Asked Questions
What is NEM's GF Score™?
Newmont’s GF Score™ is 85 out of 100, indicating strong overall financial health, profitability, growth, and momentum, though valuation is a relative weakness.
Is NEM overvalued or undervalued?
According to GF Value™, NEM is significantly overvalued by approximately 47.3%, with the current price well above its intrinsic value estimate of $78.96 per share.
What is NEM's P/E ratio compared to historical?
Newmont’s trailing P/E ratio is 14.68x, which is below its 5-year median P/E of 16.42x, suggesting the stock is not expensive relative to its historical earnings multiples despite the GF Value™ overvaluation.
This stock alert was generated using automated technology and GuruFocus financial data to provide readers with timely and accurate market reporting. This content was reviewed by GuruFocus editorial team prior to publication. Please send any questions or comments about this story to [email protected].

