


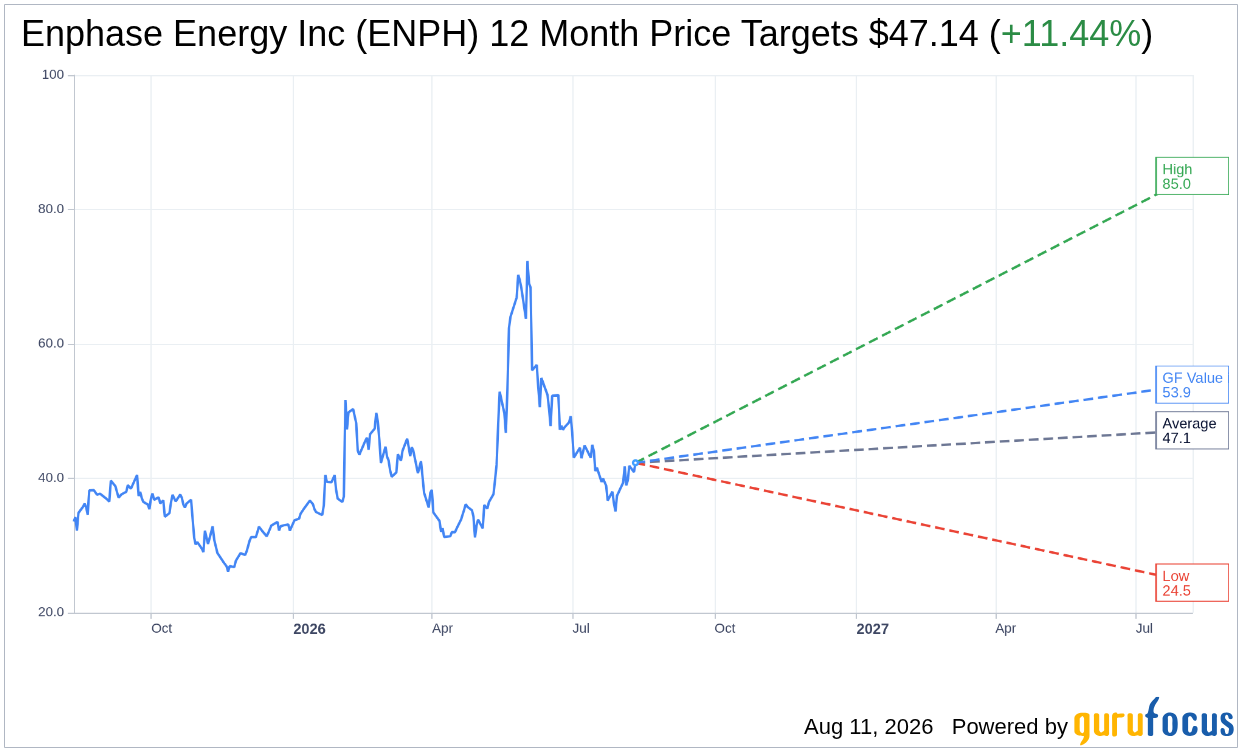
On August 11, 2026, Enphase Energy Inc ENPH shares rose 3.4%, bringing the current price to $42.30. Over the past year, the stock has seen a range from a low of $25.78 to a high of $73.74, showcasing significant volatility. The stock's price performance reflects a year-to-date increase of 32.0% and a 29.9% rise over the last year, although it has declined 5.6% in the past month and 32.1% over the last three years.
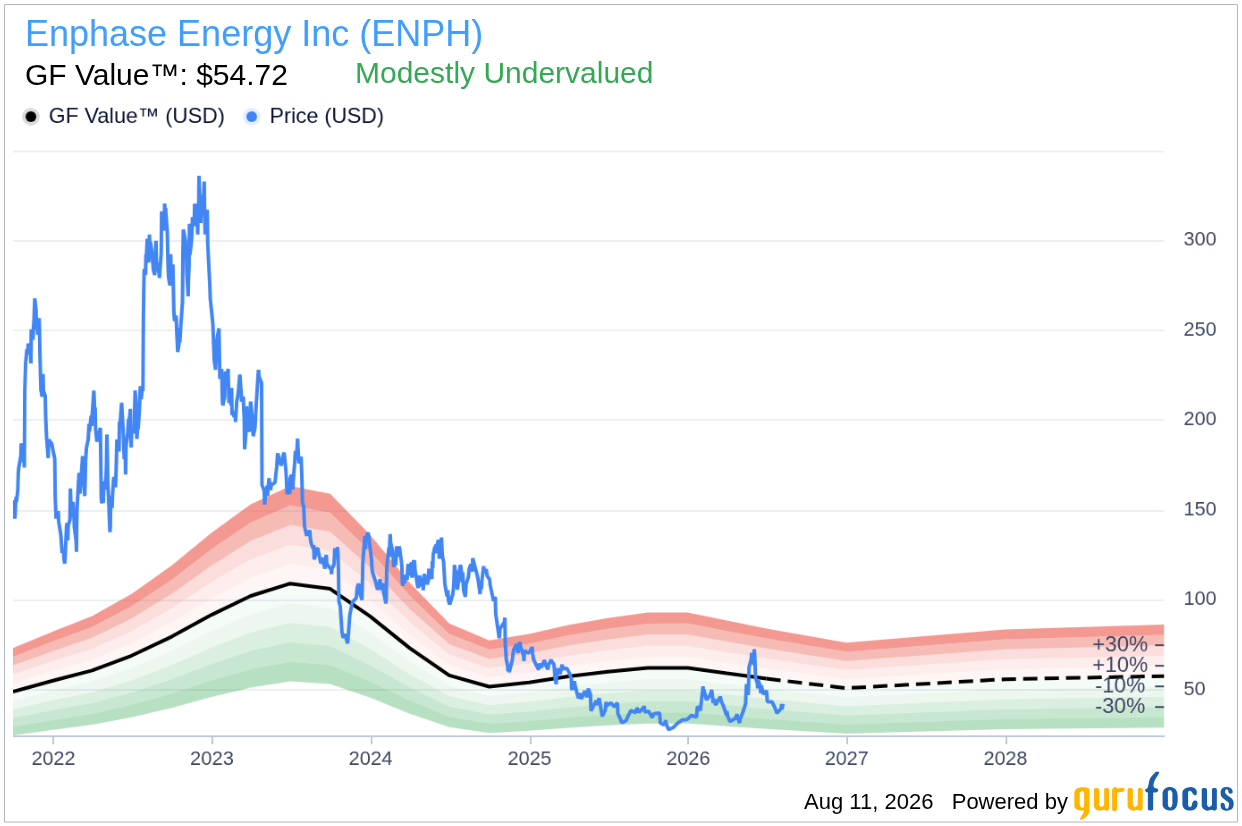
- GF Value™ verdict: Currently trading at $42.30, which is 22.7% below the GF Value™ estimate of $54.72.
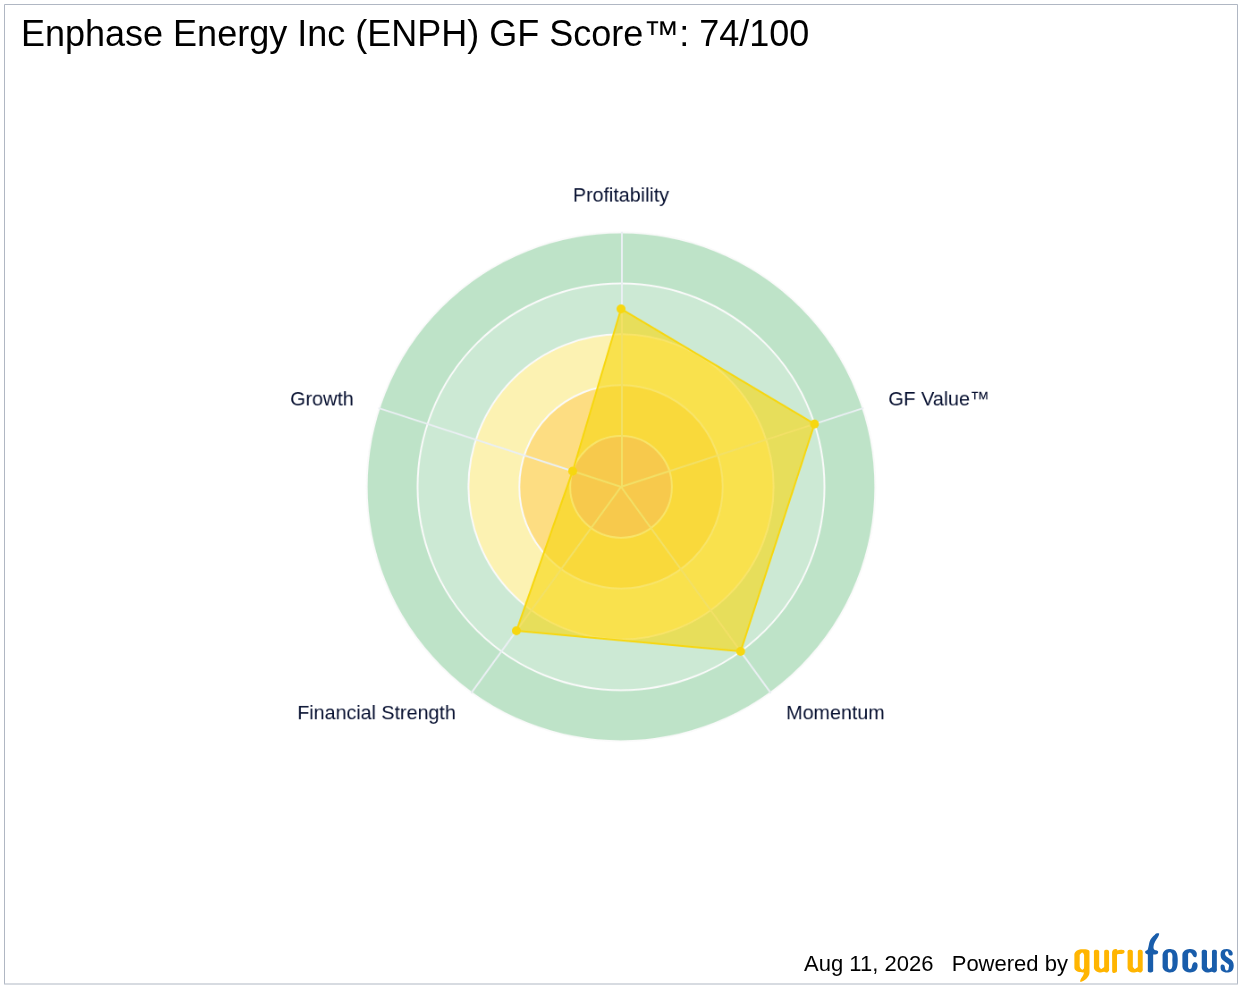
- GF Score™: 74/100, indicating above-average performance with potential for improvement.
- Notable signal: Insider activity shows a net purchase of $0.2M in the last three months, indicating some level of confidence among insiders.
Is ENPH Overvalued or Undervalued?
According to the GF Value™, Enphase Energy Inc is currently undervalued, with its stock price of $42.30 being 22.7% below the estimated fair value of $54.72. This discrepancy suggests a margin of safety for potential investors looking at the intrinsic value of the company. The GF Value™ is derived from a comprehensive analysis of historical trading multiples, past business growth, and estimates of future performance, providing an informed perspective on what the stock should be worth.
The GF Valuation label indicates that the stock is "Modestly Undervalued," presenting an opportunity for those who believe in the company's future growth potential. However, it is important to consider that while the stock is undervalued according to GF Value™, the current market conditions and the company's growth rank of 2/10 suggest caution. This could indicate challenges in maintaining growth momentum in the near future.
How Does ENPH's Valuation Compare to Its History?
| Metric | Current | Historical |
|---|---|---|
| P/E (TTM) | 42.3x | 62.5x (5-Year Median) |
| Forward P/E | 20.9x | N/A |
Enphase's current P/E ratio of 42.3x is significantly below its 5-year median of 62.5x, which indicates that the stock is trading at a discount compared to its historical valuation metrics. This P/E analysis aligns with the GF Value™ verdict, reinforcing the notion that ENPH is currently undervalued in the market.
What Does ENPH's GF Score™ Tell Us?
The GF Score™ is a multifaceted metric that evaluates a stock's overall performance based on various factors, including financial strength, profitability, growth, valuation, and momentum. Enphase Energy's GF Score™ of 74/100 reflects its above-average position in the market, but it also highlights areas that need improvement.
| Metric | Rating |
|---|---|
| GF Score™ | 74 |
| Financial Strength | 7/10 |
| Profitability | 7/10 |
| Growth | 2/10 |
| Valuation | 8/10 |
| Momentum | 8/10 |
The strongest areas for ENPH are its valuation and momentum ranks, both scoring 8/10, indicating that the stock is considered reasonably priced and has shown good price performance recently. Conversely, the growth rank of 2/10 signals potential concerns regarding the company’s ability to maintain robust growth moving forward, which may temper investor enthusiasm.
What Are Gurus and Insiders Doing with ENPH?
Currently, 7 gurus hold positions in Enphase Energy, with 2 adding to their stakes and 6 trimming their holdings in recent quarters. This mixed signal from gurus suggests a cautious approach from some institutional investors, which is critical for understanding market sentiment around the stock.
Furthermore, insider activity shows that insiders have bought $0.4M worth of shares while selling $0.2M in the last three months. This net purchase indicates some level of confidence among insiders about the company's future prospects, which could be a positive signal for potential investors. However, the selling activity should be monitored closely as it may indicate caution or a need for liquidity among certain insiders.
What This Means for Investors
Based on the analysis, Enphase Energy Inc is currently undervalued according to GF Value™, with a significant margin of safety of 22.7%. While the stock does face challenges in growth, the favorable valuation and positive insider activity suggest potential opportunities for investors. To explore more about Enphase Energy and its valuation metrics, visit the Enphase Energy Inc ENPH stock page, and optionally check the GF Value™ page or the GuruFocus Stock Screener.
Frequently Asked Questions
What is ENPH's GF Score™?
ENPH's GF Score™ is 74/100, indicating above-average performance with room for improvement across several metrics.
Is ENPH overvalued or undervalued?
ENPH is currently undervalued according to GF Value™, trading 22.7% below its estimated fair value.
What is ENPH's P/E ratio?
ENPH's P/E ratio is 42.3x, which is significantly below its 5-year median of 62.5x, suggesting the stock is trading at a discount compared to its historical valuation.
This stock alert was generated using automated technology and GuruFocus financial data to provide readers with timely and accurate market reporting. This content was reviewed by GuruFocus editorial team prior to publication. Please send any questions or comments about this story to [email protected].

