


On August 12, 2026, Nebius Group NV NBIS reported second-quarter results that surpassed analyst expectations, driving a 13% jump in after-hours trading. Despite the positive earnings surprise, the company remains unprofitable, and its valuation metrics reflect significant investor optimism about future growth rather than current profitability.
- Price-to-Sales (P/S) ratio stands at an elevated 65.5x, vastly exceeding Nebius’s historical median of 6.8x and signaling that the market is pricing in substantial future expansion; earnings-based valuation metrics like P/E are not meaningful given persistent losses and negative cash flow.
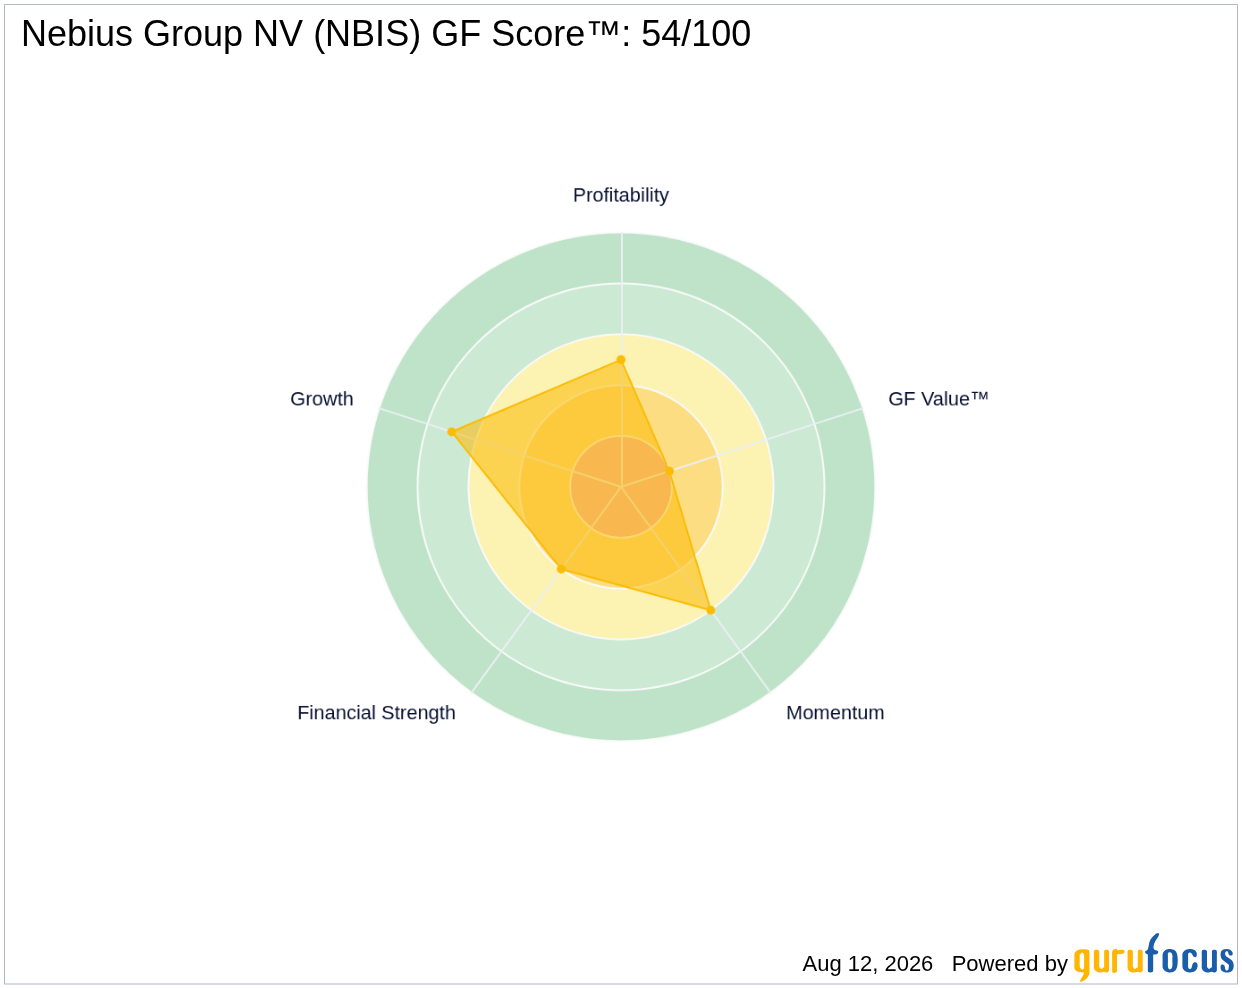
- GF Score™ of 54/100 indicates a moderate overall fundamental quality, with growth ranking as the strongest facet and valuation as the weakest.
- Insider activity shows no purchases but significant selling totaling $138.8 million over the past three months, while seven prominent gurus hold NBIS shares and have collectively added to their positions recently.
What's Behind the News?
Nebius Group NV announced a second-quarter GAAP EPS loss of $0.68, which, while negative, beat consensus estimates by $0.18. Revenue surged 454% year-over-year to $582.3 million, surpassing forecasts by $8.36 million. This robust top-line growth reflects Nebius’s rapid expansion as a vertically integrated cloud provider specializing in AI and high-performance computing services. The company operates its own data centers and servers across Europe and the United States, building on its heritage as a carve-out from the former Russian tech giant Yandex amid geopolitical sanctions.
With a market capitalization of $49.06 billion, Nebius is positioned within the Communication Services sector, specifically in the Interactive Media industry. Its recent strategic partnership with Microsoft, secured in September 2025 under a multiyear $17 billion contract to supply computing capacity, underscores its growing footprint in cloud infrastructure. Despite impressive revenue growth, Nebius continues to operate at a loss, reflecting the capital-intensive nature of its business and ongoing investments in infrastructure and technology.
Is NBIS Overvalued on a Price-to-Sales Basis?
Nebius’s current Price-to-Sales (P/S) ratio of 65.5x is extraordinarily high compared to its own five-year median P/S of approximately 6.8x. This disparity highlights that investors are pricing in aggressive future revenue growth and market share gains rather than relying on current earnings or cash flow metrics. The company’s trailing twelve-month sales stand at $877.9 million, but the valuation implies expectations for sustained rapid expansion and eventual profitability.
Given Nebius’s unprofitable status and negative free cash flow, traditional earnings-based valuation metrics such as the P/E ratio (currently 63.48x trailing and an even more stretched forward P/E of 215.08x) are not reliable indicators of value. The market’s focus is clearly on top-line momentum and strategic positioning rather than near-term earnings. Investors should note that the GF Value™ metric cannot be meaningfully applied here due to the company’s lack of profitability and cash flow challenges, serving only as a directional caution rather than a precise valuation benchmark.
What Does NBIS's GF Score™ Tell Us?
The GF Score™ aggregates multiple dimensions of a company’s financial health, including profitability, growth, financial strength, valuation, and momentum, to provide a comprehensive snapshot of its fundamental quality. Nebius’s GF Score™ of 54 out of 100 places it in the moderate range, reflecting a balance of strengths and weaknesses.
| Metric | Rating |
|---|---|
| GF Score™ | 54/100 |
| Financial Strength | 4/10 |
| Profitability | 5/10 |
| Growth | 7/10 |
| Valuation | 2/10 |
| Momentum | 6/10 |
Nebius’s strongest area is growth, consistent with its explosive revenue increases and strategic contracts like the one with Microsoft. Momentum is also relatively healthy, supported by recent share price gains. However, the company’s financial strength is moderate at best, with a 4/10 rating reflecting concerns such as ongoing losses, debt issuance, and some financial stress signals. Valuation ranks weakest, underscoring the market’s premium pricing relative to fundamentals. Profitability remains middling, as Nebius continues to operate at a loss despite top-line growth. For more details, visit the NBIS stock page.
What Are Gurus and Insiders Doing with NBIS?
GuruFocus tracks that seven prominent investment gurus currently hold positions in NBIS, and notably, all seven have increased their stakes in recent quarters without any trimming activity. This collective bullish stance from well-regarded investors suggests confidence in Nebius’s long-term growth prospects despite short-term profitability challenges. In contrast, insider activity reveals a different narrative: insiders have not made any purchases over the past three months but have sold shares totaling approximately $138.8 million. This insider selling, absent any buying, may raise questions about management’s confidence or liquidity needs, and investors should weigh this signal carefully alongside guru ownership trends.
What This Means for Investors
Nebius Group’s recent earnings beat and revenue surge highlight its rapid growth trajectory in the cloud computing and AI infrastructure space. However, the company remains unprofitable and cash-flow negative, which renders traditional earnings-based valuation metrics like P/E less relevant. The extraordinarily high Price-to-Sales ratio signals that the market is pricing in significant future expansion, but this comes with elevated risk given the company’s financial stress indicators and insider selling activity. The mixed signals from strong guru accumulation versus insider selling underscore the importance of monitoring both external and internal stakeholder behavior. Investors interested in Nebius should consider these dynamics carefully and can explore further insights on the NBIS stock page.
Frequently Asked Questions
What is NBIS's GF Score™?
NBIS’s GF Score™ is 54 out of 100, reflecting a moderate overall fundamental quality with particular strength in growth and momentum but weaknesses in valuation and financial strength.
Is NBIS overvalued or undervalued?
Based on its Price-to-Sales ratio of 65.5x, which far exceeds its historical median of 6.8x, NBIS appears overvalued on a sales basis. Earnings-based valuation metrics like P/E are not meaningful due to the company’s ongoing losses.
What is NBIS's P/E ratio compared to historical?
NBIS’s trailing P/E ratio is 63.48x, significantly higher than its five-year median of 27.81x, and the forward P/E is even more stretched at 215.08x. However, given the company’s unprofitable status, these figures are not reliable indicators of value.
This stock alert was generated using automated technology and GuruFocus financial data to provide readers with timely and accurate market reporting. This content was reviewed by GuruFocus editorial team prior to publication. Please send any questions or comments about this story to [email protected].

