


On August 12, 2026, Super Micro Computer Inc (NASDAQ: SMCI) shares surged approximately 8% in premarket trading following its fiscal fourth quarter earnings release. The company beat earnings expectations thanks to improved gross margins but missed revenue estimates. Management issued a robust fiscal 2027 revenue guidance far exceeding consensus forecasts, sparking renewed investor interest.
- SMCI’s Price-to-Sales (P/S) ratio stands at 0.64x, slightly above its historical median of 0.56x but still low for the technology hardware sector, signaling the market’s skepticism about sustained growth and profitability; earnings-based valuation metrics like P/E are less relevant given the company’s unprofitable, cash-flow-negative status.
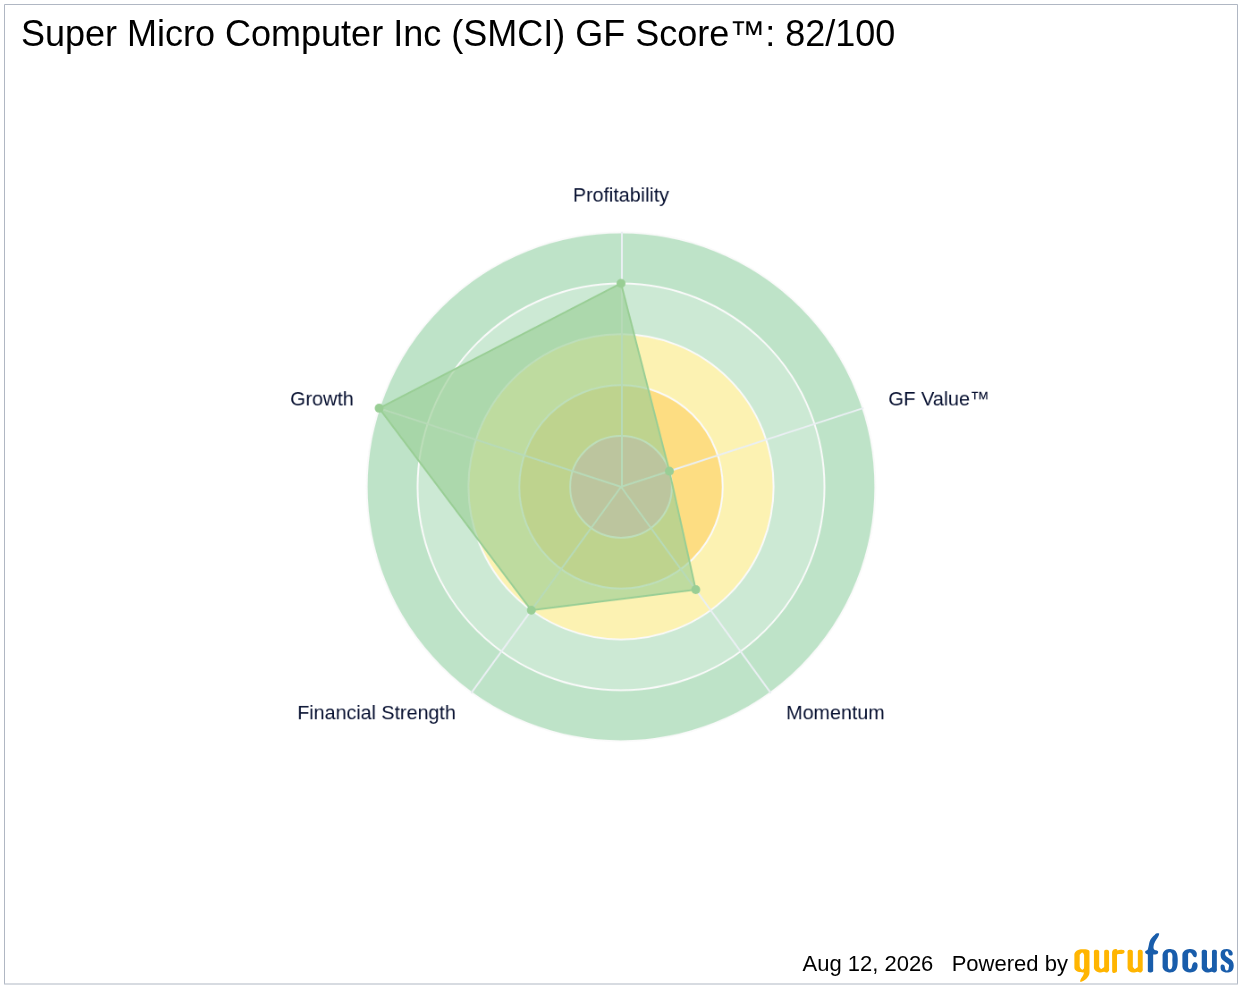
- SMCI holds a strong GF Score™ of 84/100, reflecting solid overall fundamentals despite some financial red flags.
- GuruFocus data shows 7 premium gurus currently hold SMCI, with 6 adding shares and 2 trimming recently, highlighting mixed but active institutional interest; insider selling has been notable over the past year, with no recent insider buying reported.
What's Behind the News?
Super Micro Computer’s recent earnings report revealed a mixed performance: while revenue fell short of expectations, the company delivered earnings above consensus, driven by improved gross margins. Management’s guidance for fiscal 2027 revenue at $68.5 billion significantly outpaces the anticipated $54.4 billion, suggesting confidence in accelerating growth despite near-term challenges. The upbeat outlook helped lift shares in early trading, though some analysts remain cautious, citing concerns about margin sustainability and long-term growth prospects.
Super Micro Computer Inc operates in the technology sector, specializing in high-performance server technology solutions for cloud computing, data centers, AI, and IoT markets. With a market capitalization of $20.44 billion, SMCI offers a broad product portfolio including servers, storage systems, modular blade servers, and server management software. The company generates over half its revenue in the United States, with additional contributions from Europe and Asia.
Is SMCI Overvalued on a Price-to-Sales Basis?
SMCI’s current Price-to-Sales ratio of 0.64x is modestly above its historical median of 0.56x but remains low relative to typical valuations in the technology hardware industry. This low multiple reflects the market’s cautious stance on the company’s ability to sustain growth and improve profitability. Importantly, traditional earnings-based valuation metrics like the P/E ratio are not meaningful here because SMCI is currently unprofitable and cash-flow negative, as evidenced by its negative free cash flow yield and operating cash flow decline.
GuruFocus’ proprietary GF Value™ metric estimates SMCI’s intrinsic value at $88.64 per share, implying the stock is approximately 64.4% undervalued relative to its current price of $31.60. However, this valuation should be interpreted cautiously. GF Value™ relies on historical trading multiples and growth estimates, which can be unreliable for companies like SMCI facing profitability challenges and margin pressures. Thus, while the GF Value™ suggests potential undervaluation, it also serves as a directional warning signal rather than a precise price target. For more on GF Value™, see GF Value™.
What Does SMCI's GF Score™ Tell Us?
The GF Score™ is a composite measure that evaluates a company’s overall financial health, profitability, growth, valuation, and momentum to provide a holistic view of its investment quality. SMCI’s GF Score™ of 84/100 indicates strong fundamentals relative to its peers, driven primarily by robust growth and improving profitability metrics, despite some financial risks.
| Metric | Rating |
|---|---|
| GF Score™ | 84/100 |
| Financial Strength | 6/10 |
| Profitability | 8/10 |
| Growth | 10/10 |
| Valuation | 2/10 |
| Momentum | 7/10 |
SMCI’s strongest attribute is its growth rank (10/10), reflecting impressive revenue and earnings expansion over recent years. Profitability is solid at 8/10, supported by margin improvements and positive operating trends. Financial strength is moderate (6/10), tempered by a low Piotroski F-Score and some concerns flagged by the Beneish M-Score, which suggests potential earnings manipulation risks. Valuation ranks poorly (2/10), consistent with the market’s cautious pricing and the company’s unprofitable status. Momentum is decent (7/10), aligned with recent share price gains. For further details, visit the SMCI stock page.
What Are Gurus and Insiders Doing with SMCI?
GuruFocus tracks 7 premium gurus holding SMCI, with 6 having increased their positions and 2 trimming shares in recent quarters. This active guru ownership suggests a nuanced institutional view, with some confident in the company’s growth potential while others remain cautious. Insider activity over the past 12 months shows 5 insider sales totaling approximately $7.36 million, with no insider purchases reported. The absence of recent insider buying may signal limited confidence from company executives despite the positive earnings surprise and guidance.
What This Means for Investors
SMCI’s valuation story is complex. The company’s low Price-to-Sales ratio relative to its historical median and industry peers indicates that the market is pricing in significant risks around sustained growth and profitability. Earnings-based metrics like P/E are not applicable given SMCI’s unprofitable and cash-flow-negative status, making sales-based valuation more relevant. Although the GF Value™ suggests the stock is substantially undervalued, this figure should be treated as a directional alert rather than a definitive target due to the company’s financial uncertainties. The mixed signals from institutional and insider ownership further underscore the need for caution. Investors considering SMCI should weigh its strong growth prospects against profitability challenges and financial risks. For a deeper dive into SMCI’s fundamentals and valuation, explore the SMCI stock page.
Frequently Asked Questions
What is SMCI's GF Score™?
SMCI’s GF Score™ is 84 out of 100, reflecting strong growth and profitability but moderate financial strength and weak valuation metrics. It provides a comprehensive snapshot of the company’s overall financial health and investment quality.
Is SMCI overvalued or undervalued?
Based on Price-to-Sales, SMCI appears undervalued relative to its historical median and industry peers, but earnings-based valuation like P/E is not meaningful since the company is currently unprofitable and cash-flow negative.
What is SMCI's P/E ratio compared to historical?
SMCI’s trailing P/E ratio is 16.72x, below its 5-year median of 19.34x, but given the company’s unprofitable status and negative cash flow, P/E is not a reliable valuation metric in this case.
This stock alert was generated using automated technology and GuruFocus financial data to provide readers with timely and accurate market reporting. This content was reviewed by GuruFocus editorial team prior to publication. Please send any questions or comments about this story to [email protected].

