


On August 12, 2026, Nebius Group NV NBIS saw its stock price jump approximately 15% in premarket trading following the release of its second quarter results that surpassed analyst expectations. The company reported an extraordinary 454% year-over-year revenue increase, driven by strong demand for AI computing capacity and several multibillion-dollar contracts.
- Nebius’s current Price-to-Sales (P/S) ratio stands at 65.5x, vastly exceeding its historical median of 6.8x, signaling that the market is pricing in aggressive future growth; earnings-based valuation metrics like P/E are not applicable due to ongoing losses.
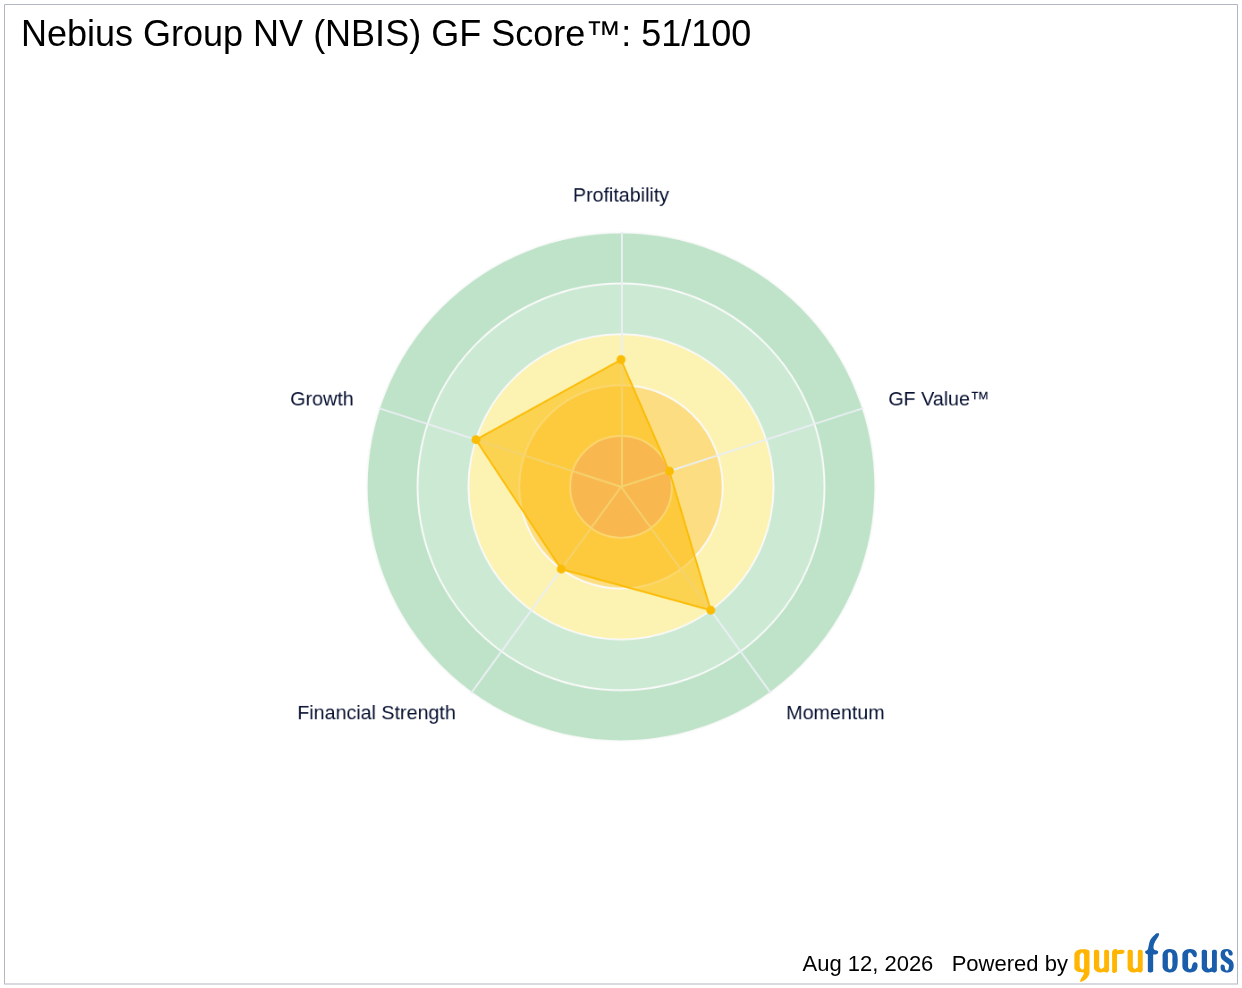
- The company’s GF Score™ is 51/100, reflecting a mixed fundamental profile with moderate growth and profitability but weak valuation and financial strength.
- Insider activity shows significant selling with no insider purchases in the past three months, totaling $138.8 million sold, while seven top gurus have increased their holdings recently, underscoring divergent sentiment between insiders and institutional investors.
What's Behind the News?
Nebius’s second quarter results revealed a staggering 454% revenue growth year-over-year, reaching $582.3 million, well above analyst expectations. Despite reporting a GAAP net loss per share of $0.68, the company’s CEO Arkady Volozh emphasized the surge in demand for AI computing power, highlighting the closure of four major contracts, each averaging over $1 billion. Nebius reaffirmed its full-year 2026 revenue guidance, projecting between $7 billion and $9 billion, signaling confidence in sustained growth momentum.
Nebius Group NV operates as a vertically integrated cloud provider specializing in AI and high-performance computing infrastructure. It emerged as a carve-out from the former Russian tech giant Yandex due to geopolitical sanctions, now focusing on designing and operating data centers and servers across Europe and the United States. With a market capitalization of $49.06 billion, Nebius is classified within the Communication Services sector and the Interactive Media industry, positioning itself at the forefront of AI cloud infrastructure.
Is NBIS Overvalued on a Price-to-Sales Basis?
Nebius’s current Price-to-Sales ratio of 65.5x is extraordinarily high compared to its own five-year median P/S of approximately 6.8x. This premium valuation indicates that investors are pricing in exceptional future revenue growth and market dominance in AI cloud services. However, traditional earnings-based valuation metrics such as the P/E ratio are not meaningful in this context because Nebius remains unprofitable and cash-flow negative, as reflected in its negative operating margins and GAAP losses. The forward P/E ratio is effectively non-existent, underscoring the limited usefulness of earnings multiples for this company at present.
While the company’s GF Value™ cannot be reliably calculated due to its financial profile, the directional signal from GuruFocus’s valuation model suggests caution. Investors should interpret the lofty P/S multiple as a bet on Nebius’s ability to convert rapid top-line growth into sustainable profitability over time. For more on GF Value™, see GF Value™ for NBIS.
What Does NBIS's GF Score™ Tell Us?
The GF Score™ aggregates multiple fundamental factors including financial strength, profitability, growth, valuation, and momentum to provide a holistic view of a company’s investment quality. Nebius’s GF Score™ of 51/100 places it near the midpoint, reflecting a balance of strengths and weaknesses across these dimensions.
| Metric | Rating (out of 10) |
|---|---|
| GF Score™ | 51 |
| Financial Strength | 4 |
| Profitability | 5 |
| Growth | 6 |
| Valuation | 2 |
| Momentum | 6 |
Nebius’s strongest areas are growth and momentum, consistent with its rapid revenue expansion and recent stock price performance. Profitability is moderate but challenged by persistent losses and negative operating margins. Financial strength is relatively weak, reflecting concerns such as ongoing debt issuance and potential financial stress indicated by an Altman Z-Score in the grey zone. Valuation ranks lowest, highlighting the stretched multiples investors are paying for future growth prospects. For further details, visit the NBIS stock page.
What Are Gurus and Insiders Doing with NBIS?
GuruFocus tracks that seven prominent gurus currently hold positions in Nebius, with all seven having added to their stakes in recent quarters and none trimming their holdings. This institutional accumulation signals confidence among some of the market’s most experienced investors in Nebius’s long-term potential. In contrast, insider activity reveals a different narrative: insiders have sold approximately $138.8 million worth of shares over the past three months, with no insider purchases reported. This divergence between insider selling and guru buying may reflect differing views on valuation, liquidity needs, or timing.
What This Means for Investors
Nebius’s stock price surge following its strong revenue beat underscores the market’s enthusiasm for its AI cloud infrastructure growth story. However, the company remains unprofitable and cash-flow negative, which renders traditional earnings-based valuation metrics ineffective. The extremely high Price-to-Sales ratio implies that investors are betting heavily on Nebius’s ability to sustain rapid revenue growth and eventually achieve profitability. Meanwhile, the mixed GF Score™ and weak financial strength caution that risks remain, particularly given insider selling activity. Investors should weigh the bullish institutional guru accumulation against these risks and monitor whether Nebius can translate its top-line momentum into durable earnings. More insights and updated data are available on the NBIS stock page.
Frequently Asked Questions
What is NBIS's GF Score™?
Nebius’s GF Score™ is 51 out of 100, indicating a moderate overall fundamental quality with strengths in growth and momentum but weaknesses in valuation and financial strength.
Is NBIS overvalued or undervalued?
Based on its Price-to-Sales ratio of 65.5x, which far exceeds its historical median of 6.8x, NBIS appears overvalued relative to its past. However, since the company is currently unprofitable, the P/E ratio is not a meaningful valuation metric.
What is NBIS's P/E ratio compared to historical?
Nebius’s trailing P/E ratio is 63.48x, significantly above its five-year median of 27.81x, but the forward P/E is not available due to ongoing losses, reflecting the company’s unprofitable status and financial challenges.
This stock alert was generated using automated technology and GuruFocus financial data to provide readers with timely and accurate market reporting. This content was reviewed by GuruFocus editorial team prior to publication. Please send any questions or comments about this story to [email protected].

