


On August 12, 2026, Brookfield Corp (NYSE: BN) is poised to report its Q2 earnings before the market opens on August 13. Investors and analysts alike will be watching closely, given the company’s mixed signals on valuation and financial health.
- Brookfield’s Price-to-Sales (P/S) ratio currently stands at 1.4x, nearly double its historical median of 0.77x, signaling the market is pricing in significant future growth despite the company’s ongoing unprofitability and negative cash flow, making traditional earnings-based valuation metrics like P/E less relevant.
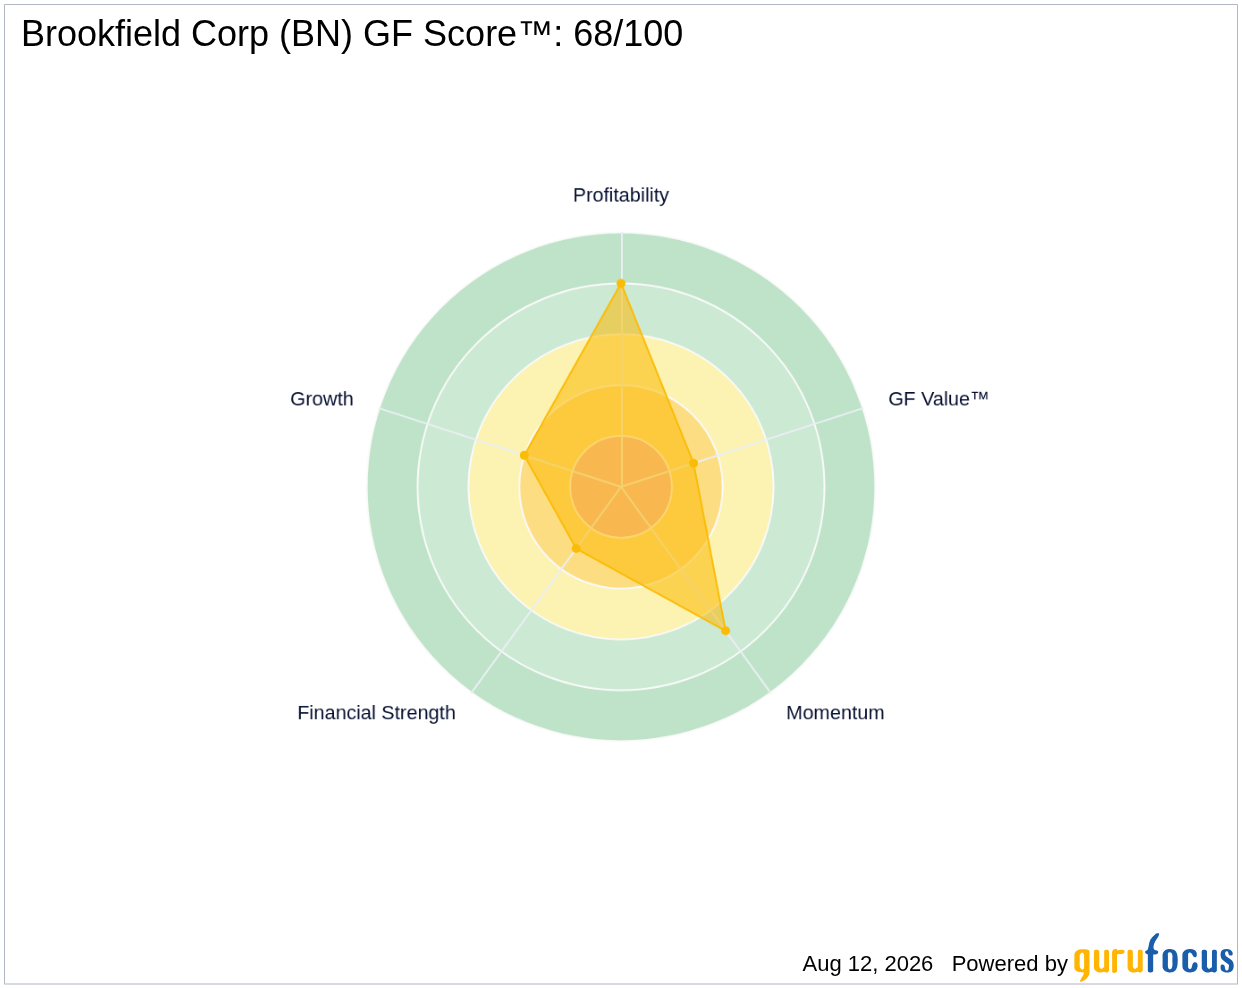
- The company holds a GF Score™ of 68 out of 100, reflecting moderate overall quality with particular strengths in profitability but weaknesses in financial strength and growth.
- Guru 13F data reveals that 15 premium gurus currently hold BN shares, though 12 have trimmed their positions recently versus only 4 adding, highlighting a cautious stance among institutional smart money investors.
What's Behind the News?
Brookfield Corp is scheduled to release its second-quarter earnings on August 13, 2026, before the market opens. This earnings announcement is significant because the company has a strong track record of beating analyst expectations, with a 100% success rate in surpassing EPS estimates and beating revenue forecasts 88% of the time over the past two years. Investors will be looking for signs of whether this trend continues amid challenging financial metrics and a complex macroeconomic backdrop.
Brookfield Corp operates in the Financial Services sector, specifically within the Asset Management industry. It is a global investment firm focused on building long-term wealth through diversified real assets, including renewable power, infrastructure, private equity, and real estate. The company’s market capitalization stands at $108.94 billion, reflecting its substantial presence across multiple regions including the United States, Canada, Europe, and Asia.
Is BN Overvalued on a Price-to-Sales Basis?
Brookfield’s current Price-to-Sales ratio of 1.4x is notably elevated compared to its 5-year median of 0.77x. This premium valuation suggests that the market is pricing in expectations of future revenue growth and operational improvements. However, it is crucial to note that Brookfield is currently unprofitable and cash-flow negative, with a trailing twelve months (TTM) net margin of just 1.77% and a negative free cash flow yield of -7.67%. As a result, traditional earnings-based valuation metrics such as the P/E ratio, which currently sits at an extreme 87.17x, are not meaningful indicators of fair value for BN at this time.
In this context, the GF Value™ metric offers a directional cautionary signal. Brookfield’s GF Value™ is $28.16, which is 57.9% below the current stock price of $44.45, indicating the shares are significantly overvalued relative to historical trading multiples and expected future performance. While GF Value™ is a proprietary intrinsic value estimate that incorporates historical data and growth forecasts, it should be interpreted carefully given the company’s loss-making status and the inherent difficulty of valuing such firms using traditional multiples. For more details, see GF Value™.
What Does BN's GF Score™ Tell Us?
The GF Score™ is a composite measure that evaluates a company’s overall quality by integrating financial strength, profitability, growth, valuation, and momentum factors. Brookfield’s GF Score™ of 68/100 places it in a moderate quality range, reflecting a mix of strengths and vulnerabilities.
| Metric | Rating (out of 10) |
|---|---|
| GF Score™ | 68 |
| Financial Strength | 3 |
| Profitability | 8 |
| Growth | 4 |
| Valuation | 3 |
| Momentum | 7 |
Brookfield’s strongest area is profitability, with an operating margin of 23.76% and an EBITDA margin of 43.64%, indicating efficient core operations despite weak net margins. Momentum is also relatively strong, reflecting recent stock price resilience. However, financial strength is a notable weakness, scoring just 3 out of 10, due to high leverage (debt-to-equity ratio of 5.64), low interest coverage (1.04), and an Altman Z-Score of 0.49 signaling distress risk. Growth metrics are modest, with revenue declining over the past three years and earnings growth negative over one year. Valuation remains a concern given the premium multiples paid by the market. For more information, visit the BN stock page.
What Are Gurus and Insiders Doing with BN?
GuruFocus tracks 15 premium gurus holding Brookfield shares, but recent activity shows a net reduction in bullishness. Over the last quarters, 12 gurus have trimmed their positions while only 4 have added, suggesting a cautious or slightly bearish stance among top institutional investors who often have deep insight into company fundamentals. This nuanced guru ownership flow is a key differentiator of GuruFocus data, offering a unique window into smart money sentiment that platforms like Simply Wall St and Morningstar do not provide.
Regarding insider activity, there have been no insider sales or purchases reported in the past 12 months, indicating a lack of recent insider transactions that might otherwise signal confidence or concern from management.
What This Means for Investors
Brookfield’s elevated Price-to-Sales ratio combined with its unprofitable and cash-flow-negative status suggests that the market is betting on a turnaround or significant future growth that is not yet reflected in current earnings. The GF Value™ metric’s indication of a 57.9% overvaluation serves as a directional warning that investors should approach with caution, especially given the company’s weak financial strength and high leverage. Meanwhile, the mixed signals from guru ownership—more trimming than adding—underscore a guarded institutional outlook. Investors should weigh these factors carefully and monitor upcoming earnings results closely to assess whether Brookfield can sustain its operational improvements and justify its premium valuation. For ongoing updates and detailed metrics, visit the BN stock page.
Frequently Asked Questions
What is BN's GF Score™?
BN’s GF Score™ is 68 out of 100, reflecting a moderate overall quality with strengths in profitability and momentum but weaknesses in financial strength and growth.
Is BN overvalued or undervalued?
Based on its Price-to-Sales ratio of 1.4x, which is nearly double its historical median, BN appears overvalued. Earnings-based valuation metrics like P/E are not meaningful here due to the company’s unprofitable and cash-flow-negative status.
What is BN's P/E ratio compared to historical?
BN’s trailing P/E ratio is an elevated 87.17x, well above its 5-year median of 81.57x, but given the company’s weak earnings and cash flow, this metric is not a reliable valuation gauge. Instead, financial strength metrics highlight concerns about leverage and liquidity.
This stock alert was generated using automated technology and GuruFocus financial data to provide readers with timely and accurate market reporting. This content was reviewed by GuruFocus editorial team prior to publication. Please send any questions or comments about this story to [email protected].

