

On August 12, 2026, Liftoff Mobile Inc (NASDAQ: LFTO) reported second-quarter results that surpassed expectations, marking an encouraging start for the company as a newly public entity. The stock currently trades with a high price-to-earnings ratio, reflecting elevated investor optimism but also raising questions about valuation.
- LFTO’s trailing twelve months (TTM) P/E ratio stands at 164.03x, slightly above its 5-year median of 158.96x, indicating a premium valuation.
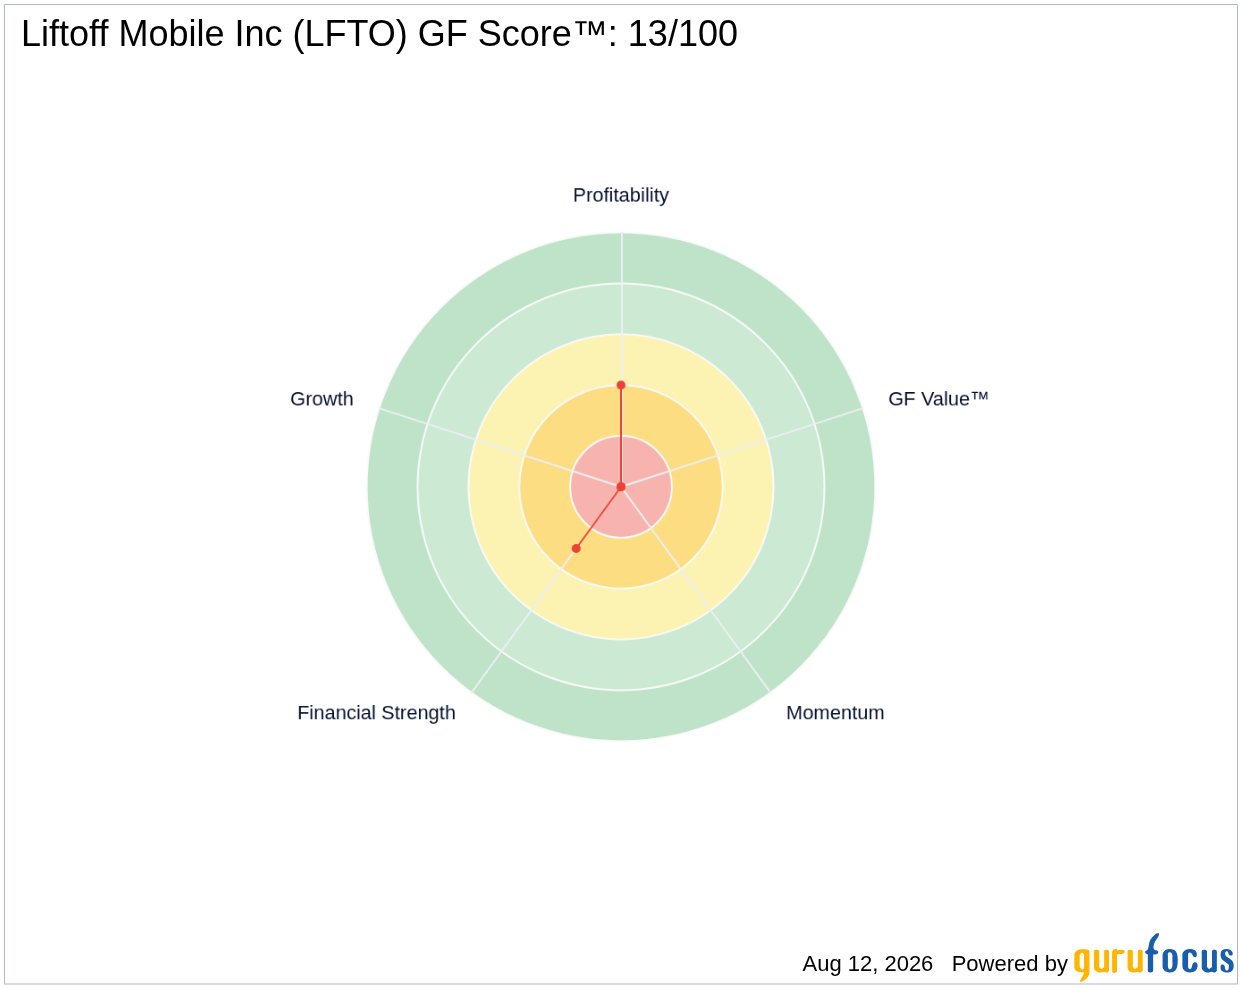
- The company’s GF Score™ is 13 out of 100, signaling significant room for improvement in overall financial health and performance.
- Insider activity shows robust confidence, with $60.0 million in insider purchases over the past three months and no insider selling reported.
What's Behind the News?
Liftoff Mobile’s better-than-expected Q2 results underscore its ability to execute in the competitive mobile advertising and app monetization space. Reporting a GAAP earnings per share of -$0.03, which beat estimates by $0.40, alongside revenues of $220 million surpassing forecasts by $12.1 million, the company is demonstrating early signs of operational momentum. This performance is notable given Liftoff Mobile’s recent transition to a public company, a phase often accompanied by heightened scrutiny and volatility.
Operating within the Communication Services sector and the diversified media industry, Liftoff Mobile Inc leverages its AI-driven platform, Cortex, to optimize marketing and monetization for mobile apps. The company’s solutions span user acquisition, engagement, analytics, and ad monetization, targeting app publishers and advertisers seeking scalable growth. With a market capitalization of $4.28 billion, Liftoff is positioned as a significant player in the mobile app economy, headquartered in Redwood City, California.
How Is LFTO Valued?
Currently, GF Value™ data is not available for Liftoff Mobile, which limits a direct assessment of its intrinsic valuation using GuruFocus’s proprietary valuation model. However, the company’s trailing P/E ratio of 164.03x is elevated relative to its 5-year median P/E of 158.96x, suggesting that the market is pricing in substantial future growth or operational improvements. The forward P/E ratio is not provided, which adds uncertainty to valuation projections. Investors should consider this premium valuation in the context of Liftoff’s early-stage profitability and growth trajectory.
For more detailed valuation metrics and updates, visit the LFTO stock page.
What Does LFTO's GF Score™ Tell Us?
The GF Score™ is a composite metric that evaluates a company’s overall financial health, profitability, growth, valuation, and momentum to provide a snapshot of its investment quality. Liftoff Mobile’s GF Score™ of 13 out of 100 reflects significant challenges, particularly in financial strength and profitability, despite some operational promise.
| Metric | Rating |
|---|---|
| GF Score™ | 13/100 |
| Financial Strength | 3/10 (Poor) |
| Profitability | 4/10 |
Liftoff’s weakest area is financial strength, scoring just 3 out of 10, driven by a distressed Altman Z-Score of 0.91, which signals a risk of bankruptcy within two years. The company’s interest coverage ratio is low at 1.57, below the preferred threshold of 5, indicating limited ability to service debt comfortably. Profitability is modest with a rank of 4 out of 10, reflecting early-stage earnings and margin pressures. The absence of growth and momentum scores in the GF Score™ suggests these factors are either neutral or not yet established. Overall, the GF Score™ highlights that while Liftoff Mobile has operational potential, financial risks remain elevated.
Explore more on Liftoff’s financial profile at the LFTO stock page.
What Are Gurus and Insiders Doing with LFTO?
GuruFocus data indicates that no premium gurus currently hold or have recently traded Liftoff Mobile shares, which is not uncommon for a relatively new public company still building institutional interest. However, insider activity is notably positive, with two insider buying transactions totaling approximately 2.6 million shares and $60.0 million in value over the past three months. There have been no insider sales reported during this period. This insider buying is a strong signal of confidence from those closest to the company’s operations and prospects, suggesting that management and key stakeholders believe in Liftoff’s growth potential despite the financial headwinds.
What This Means for Investors
While Liftoff Mobile’s Q2 earnings beat and insider buying provide encouraging signs, the company’s valuation remains stretched with a P/E ratio well above historical medians and a GF Score™ that flags financial vulnerability. The lack of GF Value™ data means investors should exercise caution and consider the margin of safety carefully. The strong insider buying activity, however, offers a noteworthy counterbalance, indicating that those with the most intimate knowledge of the company see value at current levels. Investors interested in LFTO should monitor upcoming earnings and financial strength metrics closely to assess whether Liftoff can translate its operational momentum into sustainable profitability and improved balance sheet health.
For ongoing updates and a deeper dive into Liftoff Mobile’s fundamentals, visit the LFTO stock page or explore investment opportunities using the GuruFocus Stock Screener.
Frequently Asked Questions
What is LFTO's GF Score™?
LFTO’s GF Score™ is 13 out of 100, indicating significant challenges in financial strength and profitability despite some operational progress. This score aggregates multiple financial metrics to provide an overall quality assessment.
How is LFTO valued?
Liftoff Mobile trades at a trailing P/E ratio of 164.03x, slightly above its 5-year median of 158.96x, suggesting the market expects strong future growth. GF Value™ data is currently unavailable for this stock.
What is LFTO's P/E ratio compared to historical?
The current P/E ratio of 164.03x is modestly higher than the 5-year median P/E of 158.96x, reflecting a premium valuation that investors are placing on Liftoff’s growth prospects amid early-stage profitability.
This stock alert was generated using automated technology and GuruFocus financial data to provide readers with timely and accurate market reporting. This content was reviewed by GuruFocus editorial team prior to publication. Please send any questions or comments about this story to [email protected].

