


On August 12, 2026, TSS Inc (ticker: TSSI) is poised to report its second quarter earnings after market close on August 13. Investors and analysts are closely watching this release amid mixed signals from valuation and insider activity.
- TSSI’s current Price-to-Sales (P/S) ratio of 1.69x stands well above its historical median of 0.4x, indicating the market is pricing in substantial future growth despite the company’s unprofitable and cash-flow-negative status, making traditional earnings-based valuation metrics like P/E less relevant.
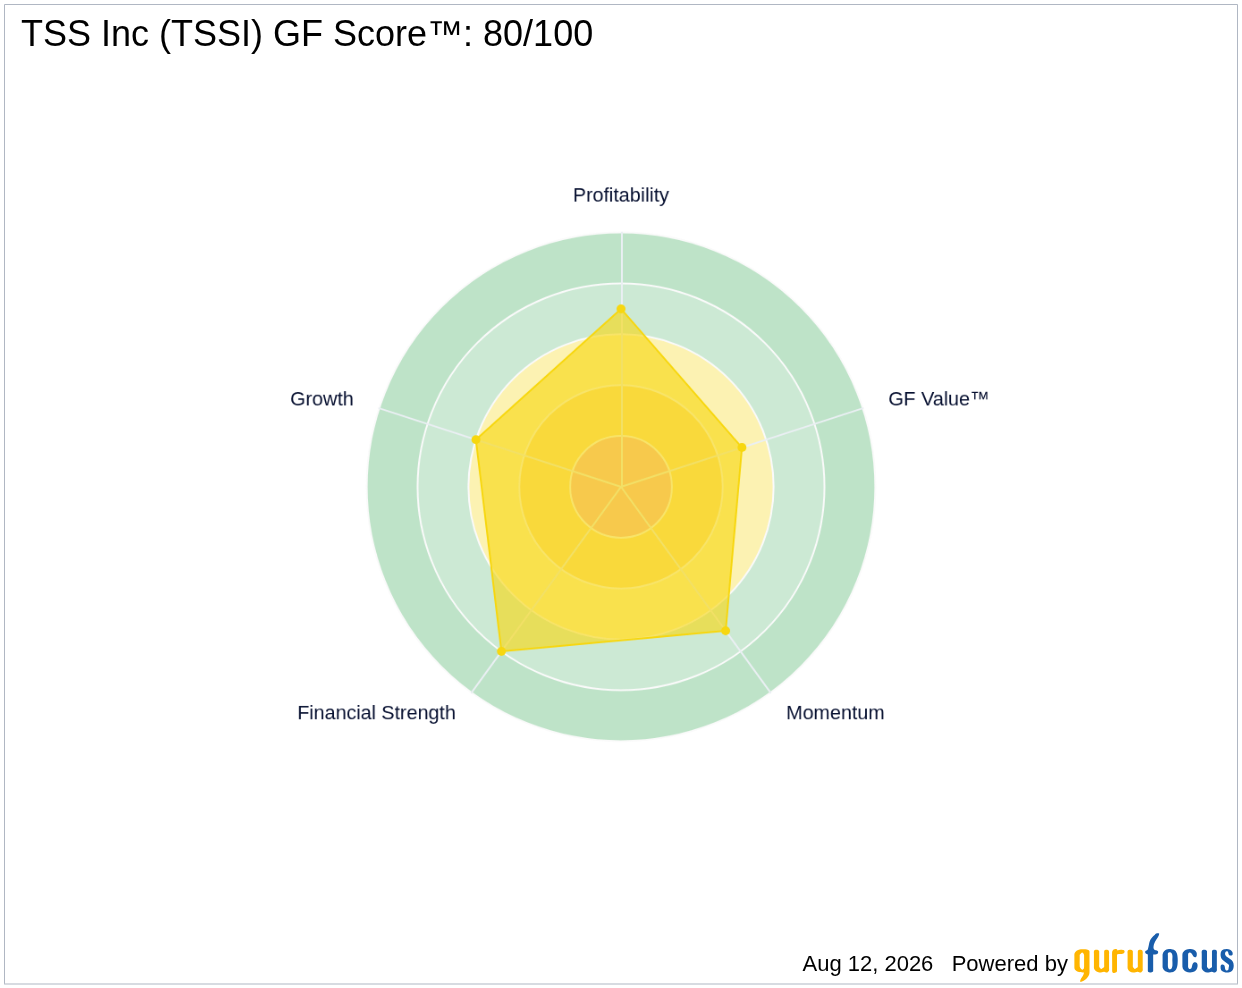
- The company holds a solid GF Score™ of 80 out of 100, reflecting strong financial health and momentum but middling growth and valuation ranks.
- Insider activity has been net negative recently, with no insider purchases and $4.9 million in insider sales over the past three months, while only one premium GuruFocus guru currently holds TSSI, with two having trimmed positions recently.
What's Behind the News?
TSS Inc is set to announce its Q2 2026 earnings on August 13 after market hours. Analysts forecast an EPS of $0.07, a 16.7% increase year-over-year, and revenues of $44.71 million, up 1.7% from the prior year. The company has seen one upward revision each for EPS and revenue estimates in the last three months, with no downward revisions, signaling modest optimism ahead of the report. This earnings release will provide fresh insight into whether TSSI can sustain its growth trajectory amid operational challenges.
Founded as a technology services provider, TSS Inc specializes in the integration of complex Artificial Intelligence (AI) technologies and mission-critical infrastructure solutions. Its offerings include technology consulting, systems integration, project management, and IT procurement services primarily for data centers, network facilities, and security operations centers. With a market capitalization of $340 million, TSSI operates in the competitive software and technology sector, where rapid innovation and execution are key to maintaining relevance and growth.
Is TSSI Overvalued on a Price-to-Sales Basis?
TSSI’s current Price-to-Sales ratio stands at 1.69, which is significantly higher than its historical median P/S of approximately 0.4. This premium valuation suggests that the market is pricing in expectations of accelerated revenue growth or margin expansion that the company has yet to fully realize. Given that TSSI remains unprofitable and reports negative free cash flow, traditional earnings-based valuation metrics such as the P/E ratio are not appropriate for assessing its stock price. The company’s trailing P/E is 24.71x, but this figure is less meaningful given the firm’s earnings volatility and cash flow challenges.
The GF Value™ for TSSI is $8.80, implying the stock is roughly 37.6% overvalued relative to this intrinsic value estimate. It is important to emphasize that GF Value™ is derived from historical trading multiples and growth expectations, which can be unreliable for companies like TSSI that are not yet consistently profitable. Therefore, this valuation should be viewed as a directional warning signal rather than a precise fair value target. For more details, see GF Value™.
What Does TSSI's GF Score™ Tell Us?
The GF Score™ is GuruFocus’ proprietary composite metric that synthesizes a company’s financial strength, profitability, growth, valuation, and momentum into a single score to help investors gauge overall quality and risk. TSSI’s GF Score™ of 80 out of 100 indicates a generally strong profile, driven by robust financial strength and positive momentum, though tempered by moderate growth and valuation concerns.
| Metric | Rating |
|---|---|
| GF Score™ | 80 |
| Financial Strength | 8/10 |
| Profitability | 7/10 |
| Growth | 6/10 |
| Valuation | 5/10 |
| Momentum | 7/10 |
TSSI’s strongest attributes lie in its financial strength and momentum, reflecting a solid balance sheet with a current ratio of 2.18, a cash ratio of 1.62, and an Altman Z-Score of 4.03, which signals low bankruptcy risk. Profitability is decent with a net margin of 7.14% and return on equity above 30%, but growth is moderate, with a three-year revenue growth rate of 80.8% offset by some operational headwinds such as declining gross margins. Valuation remains the weakest link, consistent with the elevated P/S ratio and GF Value™ overvaluation. For more comprehensive data, visit the TSSI stock page.
What Are Gurus and Insiders Doing with TSSI?
GuruFocus tracks that only one premium guru currently holds TSSI, and in recent quarters, two gurus have trimmed their positions while none have added shares. This cautious stance by institutional smart money contrasts with the insider activity, where there have been two insider selling transactions totaling approximately $4.9 million in the past three months and no insider buying. This net insider selling could indicate a lack of confidence from those closest to the company’s operations. These signals are critical as they provide a unique perspective on TSSI’s prospects beyond traditional financial metrics, a feature that sets GuruFocus apart from other platforms like Simply Wall St or Morningstar.
What This Means for Investors
Investors considering TSSI should weigh the company’s elevated Price-to-Sales ratio and GF Value™ overvaluation against its strong financial footing and solid GF Score™. The market’s premium valuation implies expectations of future growth that have yet to be fully realized, while the lack of insider buying and guru trimming suggest caution among informed stakeholders. Given TSSI’s unprofitable and cash-flow-negative status, earnings multiples are not a reliable gauge, making the P/S ratio and insider/guru activity more relevant for valuation insight. Those interested in TSSI’s evolving story can find ongoing updates and detailed metrics on the TSSI stock page.
Frequently Asked Questions
What is TSSI's GF Score™?
TSSI’s GF Score™ is 80 out of 100, reflecting strong financial health and momentum, with moderate growth and valuation ratings. This score aggregates key financial and market performance factors to provide a holistic quality assessment.
Is TSSI overvalued or undervalued?
On a Price-to-Sales basis, TSSI appears overvalued with a current P/S of 1.69 versus a historical median of 0.4, indicating the market expects significant future growth. Earnings-based valuation metrics like P/E are not meaningful here due to the company’s unprofitable and cash-flow-negative status.
What is TSSI's P/E ratio compared to historical?
TSSI’s trailing P/E ratio is 24.71, below its 5-year median of 34, but this metric is less relevant given the company’s earnings volatility and negative free cash flow. Instead, financial strength metrics and Price-to-Sales ratios provide better valuation context.
This stock alert was generated using automated technology and GuruFocus financial data to provide readers with timely and accurate market reporting. This content was reviewed by GuruFocus editorial team prior to publication. Please send any questions or comments about this story to [email protected].

