


On August 13, 2026, Omeros Corporation (NASDAQ: OMER) saw its stock price jump 15% following a strong second-quarter earnings report fueled by the successful launch of its drug YARTEMLEA. The market reaction highlights investor optimism, but valuation metrics suggest caution.
- Omeros’ current Price-to-Sales (P/S) ratio stands at an elevated 124.55x, far surpassing its historical median of approximately 17.1x, implying the market is pricing in substantial future growth despite the company’s unprofitable and cash-flow-negative status, making traditional earnings-based valuation (P/E) less relevant.
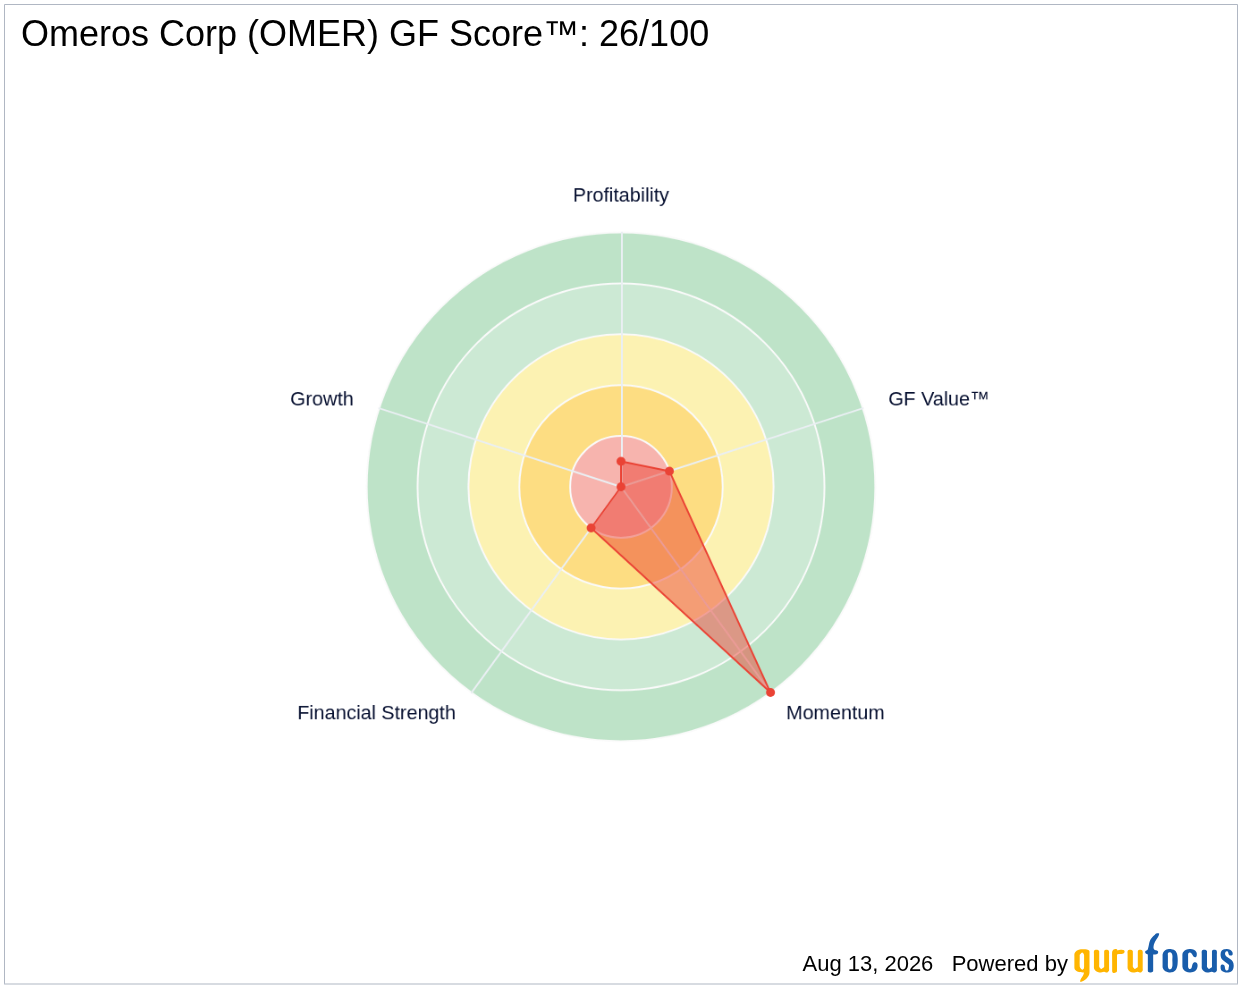
- The company’s GF Score™ is 26 out of 100, indicating weak overall fundamentals with particular challenges in financial strength and profitability.
- Insider activity shows net selling over the past three months, with insiders offloading $87,075 worth of shares and no insider buying, signaling potential caution from those closest to the company’s operations.
What's Behind the News?
Omeros Corporation’s 15% stock surge on August 13, 2026, followed a robust Q2 earnings release that showcased a dramatic revenue increase driven by the commercial launch of YARTEMLEA. The company reported gross revenue of $32.2 million, a 190% jump from the prior quarter, and net revenue of $28.5 million. Adjusted net income swung to a positive $1.8 million from a $17.1 million loss in Q1, while operating income improved to $0.1 million from a $17.4 million loss. Additionally, Omeros ended the quarter with a strong cash position of $132 million and reduced its convertible notes, easing future interest burdens. These operational improvements have fueled optimism about the company’s growth trajectory.
Omeros Corp operates in the biotechnology sector, focusing on developing first-in-class protein and small-molecule therapeutics targeting complement-mediated diseases, cancers, and addictive or compulsive disorders. Its pipeline includes clinical-stage programs such as narsoplimab, OMS1029, and OMS527. With a market capitalization of $992 million, Omeros is a commercial-stage biotech company navigating the challenging path from clinical development to sustained profitability.
Is OMER Overvalued on a Price-to-Sales Basis?
Omeros’ current Price-to-Sales ratio of 124.55x is strikingly high compared to its historical median P/S of approximately 17.1x. This extreme premium suggests that investors are pricing in significant future revenue growth and successful commercialization of its pipeline products. However, given that Omeros remains unprofitable and cash-flow-negative, traditional earnings-based valuation metrics like the P/E ratio are not meaningful here. The company’s trailing twelve months P/E stands at 19.57x, close to its one-year high, but this figure should be interpreted cautiously given the volatile earnings and losses in recent quarters.
While the GF Value™ metric currently cannot provide a reliable fair value estimate for Omeros due to its financial profile, it serves as a directional warning. Investors should be aware that the lofty P/S multiple reflects high expectations that may be difficult to sustain without consistent profitability and cash flow generation. For more on GF Value™, visit GF Value™ for OMER.
What Does OMER's GF Score™ Tell Us?
The GF Score™ aggregates multiple dimensions of a company’s financial health, including profitability, growth, financial strength, valuation, and momentum, to provide a holistic view of its investment quality. Omeros’ GF Score™ of 26 out of 100 indicates significant weaknesses, particularly in financial strength and profitability, despite strong momentum driven by recent stock price gains.
| Metric | Rating |
|---|---|
| GF Score™ | 26/100 |
| Financial Strength | 2/10 (Poor) |
| Profitability | 1/10 (Very Weak) |
| Valuation | 2/10 (Below Average) |
| Momentum | 10/10 (Excellent) |
Omeros’ strongest area is momentum, reflecting recent positive stock price movement and operational improvements. However, the company’s poor financial strength rating stems from high debt levels and a distressed Altman Z-Score of -0.89, signaling potential bankruptcy risk. Profitability remains a major concern, with operating margins deeply negative historically. The valuation rank is low, reflecting the market’s expensive pricing relative to fundamentals. For a detailed view, see the OMER stock page.
What Are Gurus and Insiders Doing with OMER?
Currently, no premium GuruFocus gurus hold or have recently traded Omeros shares, meaning there is no guru 13F activity to report. This absence of guru ownership removes a layer of institutional confidence that some investors seek. Meanwhile, insider activity over the last three months shows net selling, with insiders selling approximately $87,075 worth of shares and no insider purchases reported. This insider selling may indicate a cautious or less optimistic outlook from those with the most intimate knowledge of the company’s prospects.
What This Means for Investors
Omeros Corporation’s recent operational turnaround and revenue growth have sparked enthusiasm, as reflected in a 15% stock price jump. However, the company’s valuation on a Price-to-Sales basis is extraordinarily high compared to its historical norms and industry standards, signaling that the market is pricing in substantial future growth that remains uncertain. The lack of insider buying combined with poor financial strength metrics and a distressed bankruptcy risk score suggest caution. Investors should carefully weigh these factors, recognizing that earnings-based valuation metrics like P/E are not applicable given Omeros’ unprofitable and cash-flow-negative status. For those interested in a deeper dive into Omeros’ financial and valuation metrics, visit the OMER stock page.
Frequently Asked Questions
What is OMER's GF Score™?
OMER’s GF Score™ is 26 out of 100, reflecting weak financial strength and profitability but strong momentum. The score provides a composite view of the company’s overall financial health and market performance.
Is OMER overvalued or undervalued?
Based on its Price-to-Sales ratio of 124.55x, which is significantly above its historical median of about 17.1x, OMER appears overvalued relative to sales. Since the company is unprofitable and cash-flow-negative, the P/E ratio is not a meaningful valuation metric here.
What is OMER's P/E ratio compared to historical?
OMER’s trailing twelve months P/E ratio is 19.57x, close to its one-year high of 21.51x. However, given the company’s volatile earnings and recent losses, this P/E figure should be interpreted with caution and is less relevant than sales-based valuation.
This stock alert was generated using automated technology and GuruFocus financial data to provide readers with timely and accurate market reporting. This content was reviewed by GuruFocus editorial team prior to publication. Please send any questions or comments about this story to [email protected].

