


On August 13, 2026, amid growing alarm over a potential bubble in AI investments and capital spending, NVIDIA Corp NVDA stands out with a compelling valuation gap according to GuruFocus metrics.
- GF Value™ indicates NVDA is trading at $225.43, roughly 40.7% below its intrinsic value estimate of $379.84.
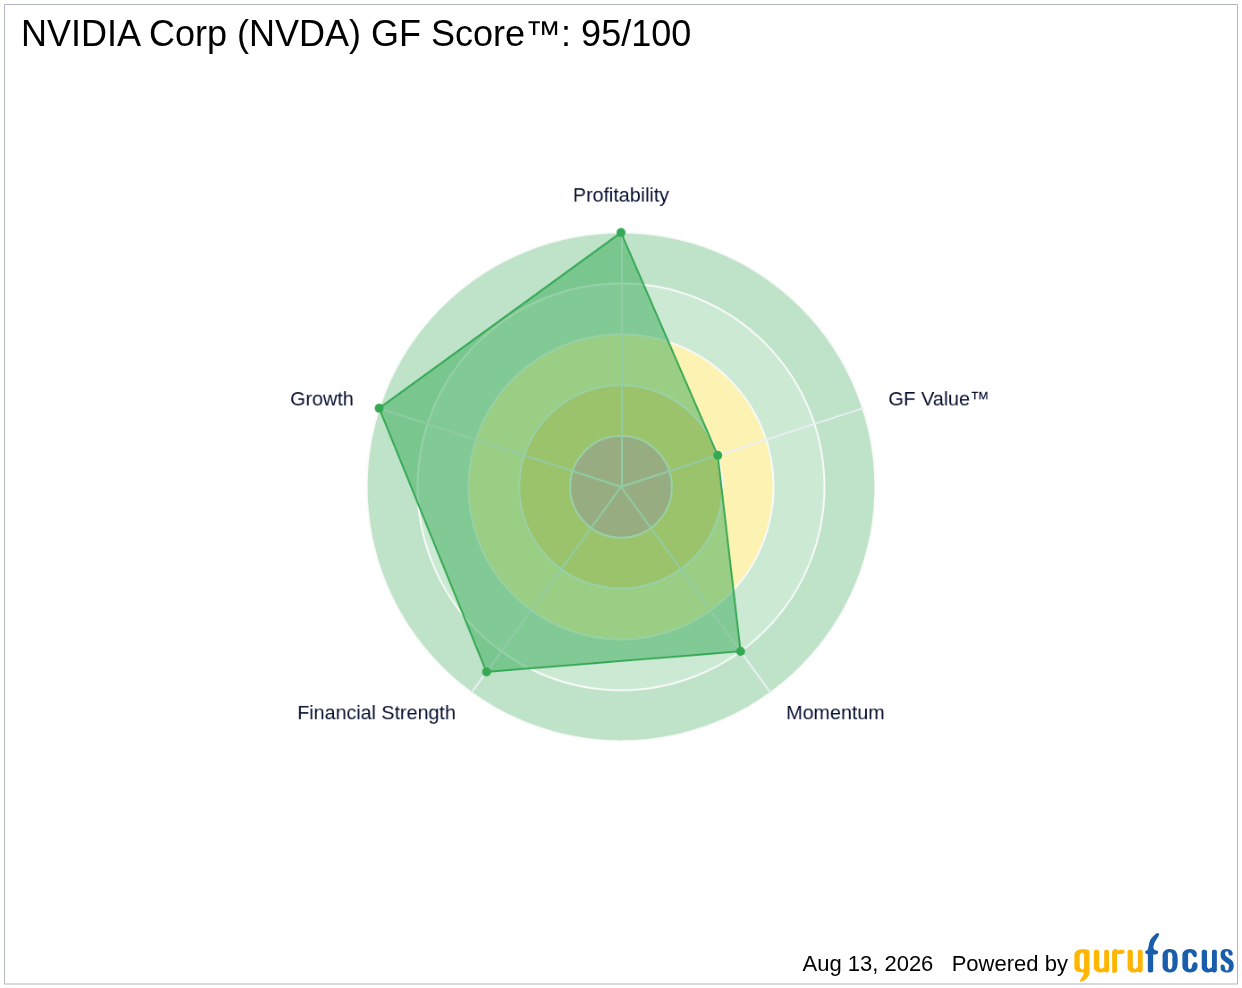
- NVDA scores an impressive 95 out of 100 on the GF Score™, reflecting robust overall financial health and operational excellence.
- Despite strong fundamentals, insider activity shows net selling with no insider purchases reported in the last three months, totaling $410.6 million in shares sold.
What's Behind the News?
Analyst Sara Awad recently raised concerns about a potential bubble in AI investments, highlighting a widening disconnect between the massive capital expenditures in AI infrastructure and the lack of proportional returns. She specifically pointed to Nvidia's role in financing customers, which could amplify risks in the sector. Discussions around a $250 billion backstop for OpenAI and up to $350 billion for data center chip deployments underscore the scale of investment flowing into AI hardware and software ecosystems. Meanwhile, major tech giants like Google and Amazon are facing negative free cash flow, intensifying scrutiny on AI spending strategies.
Within this context, NVIDIA Corp operates at the core of the AI hardware revolution. As a leading developer of graphics processing units (GPUs), Nvidia's products have evolved from gaming-focused applications to critical components powering artificial intelligence workloads, including large language models. The company also offers a comprehensive AI software platform, CUDA, and is expanding its data center networking solutions to support complex AI tasks. With a market capitalization of $5.46 trillion, NVDA is a dominant player in the technology sector, specifically within the semiconductor industry.
Is NVDA Overvalued or Undervalued?
GuruFocus’ proprietary GF Value™ metric estimates NVDA’s intrinsic worth at $379.84 per share, significantly above its current trading price of $225.43. This 40.7% margin of safety suggests that, despite market concerns about AI spending excesses, NVDA’s stock price may not fully reflect its underlying business strength and growth prospects. Investors looking for value in the tech sector might find this gap noteworthy, especially given the company’s dominant position in AI hardware.
Examining valuation multiples, NVDA’s trailing twelve months (TTM) price-to-earnings (P/E) ratio stands at 34.52x, which is considerably lower than its five-year median P/E of 57.4x. This compression in valuation multiples could reflect market caution amid the broader AI investment bubble fears but also signals potential undervaluation relative to historical norms. For further details on GF Value™, visit GF Value™.
What Does NVDA's GF Score™ Tell Us?
The GF Score™ aggregates multiple dimensions of a company’s financial health, profitability, growth, valuation, and momentum into a single comprehensive rating. NVDA’s outstanding score of 95/100 indicates exceptional overall quality. The company excels particularly in financial strength, profitability, and growth, each scoring near the top of their respective scales. However, valuation ranks lower, reflecting the market’s cautious pricing despite the company’s fundamentals.
| Metric | Rating |
|---|---|
| GF Score™ | 95 |
| Financial Strength | 9/10 |
| Profitability | 10/10 |
| Growth | 10/10 |
| Valuation | 4/10 |
| Momentum | 8/10 |
NVDA’s strongest attributes lie in its robust profitability and growth metrics, underscored by a 64.02% operating margin and stellar earnings growth over multiple time frames. Its financial strength is also notable, with a high Altman Z-Score of 55.77 and a Piotroski F-Score of 8, indicating a very healthy financial position. The relatively lower valuation rank signals that the market may be discounting the stock due to sector-wide concerns, despite these strengths. More information is available on the NVDA stock page.
What Are Gurus and Insiders Doing with NVDA?
GuruFocus tracks 36 premium gurus currently holding NVDA shares, with 19 increasing their positions and 16 trimming them in recent quarters. This relatively balanced but slightly positive guru activity suggests cautious optimism among top institutional investors who often have deep research capabilities. In contrast, insider activity shows no insider buying in the past three months, while insiders have sold $410.6 million worth of shares during that period. This divergence between guru accumulation and insider selling adds nuance to the investment narrative, highlighting differing perspectives on near-term valuation and risk.
What This Means for Investors
Despite the broader market’s concerns about an AI investment bubble and the risks associated with Nvidia’s customer financing role, the GF Value™ analysis suggests NVDA remains significantly undervalued by approximately 40.7%. The company’s exceptional GF Score™ and strong financial and operational metrics reinforce this view, although the lower valuation rank and insider selling caution investors to consider potential risks. The mixed signals from guru and insider activity underscore the importance of a measured approach when evaluating NVDA’s stock amid sector volatility. For a deeper dive into NVDA’s fundamentals and valuation, visit the NVDA stock page and explore opportunities through the GuruFocus Stock Screener.
Frequently Asked Questions
What is NVDA's GF Score™?
NVDA’s GF Score™ is 95 out of 100, reflecting strong financial health, profitability, and growth, making it one of the highest-rated companies on GuruFocus.
Is NVDA overvalued or undervalued?
According to GF Value™, NVDA is approximately 40.7% undervalued, trading at $225.43 compared to an intrinsic value estimate of $379.84.
What is NVDA's P/E ratio compared to historical?
NVDA’s current trailing P/E ratio is 34.52x, significantly below its five-year median P/E of 57.4x, indicating a lower valuation relative to historical norms.
This stock alert was generated using automated technology and GuruFocus financial data to provide readers with timely and accurate market reporting. This content was reviewed by GuruFocus editorial team prior to publication. Please send any questions or comments about this story to [email protected].

